. 2020 May 12;31(6):107633.
doi: 10.1016/j.celrep.2020.107633.

Systemic Type I IFN Inflammation in Human ISG15 Deficiency Leads to Necrotizing Skin Lesions

Affiliations

Systemic Type I IFN Inflammation in Human ISG15 Deficiency Leads to Necrotizing Skin Lesions

Marta Martin-Fernandez et al. Cell Rep. .

Abstract

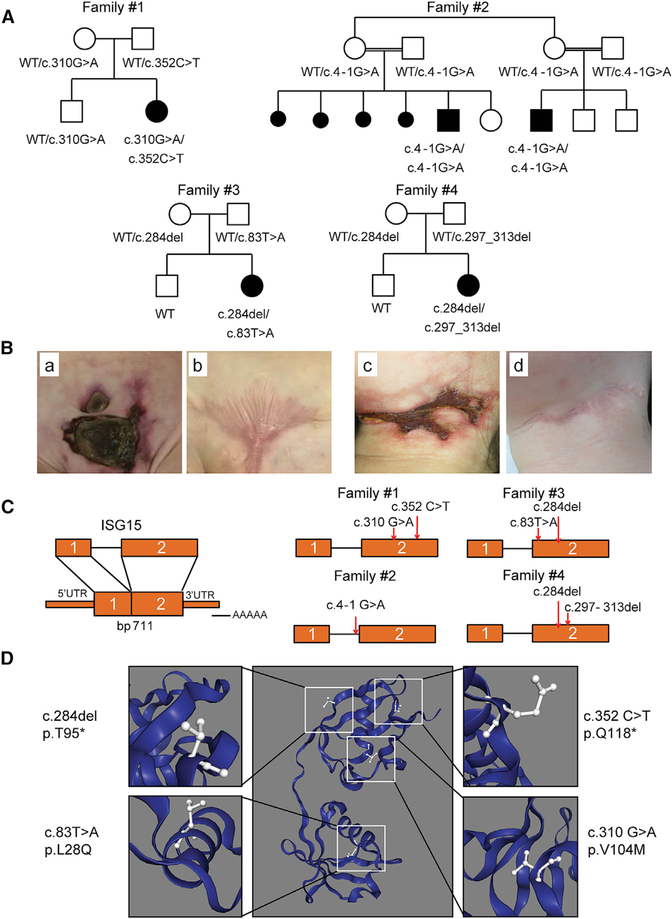
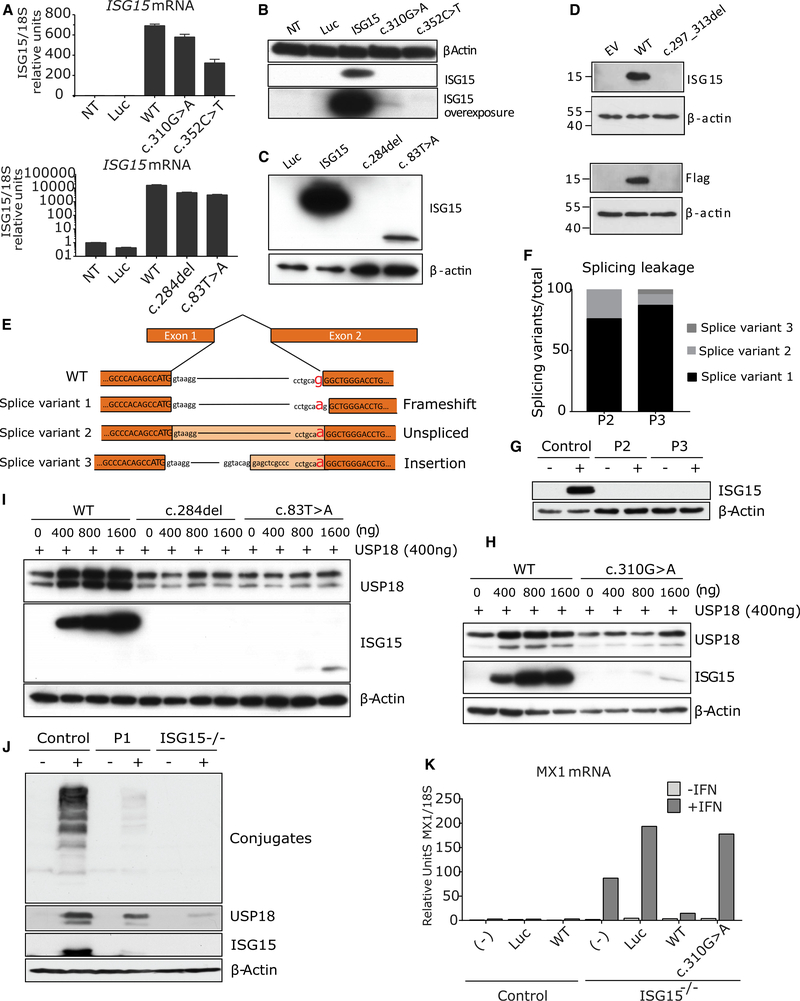
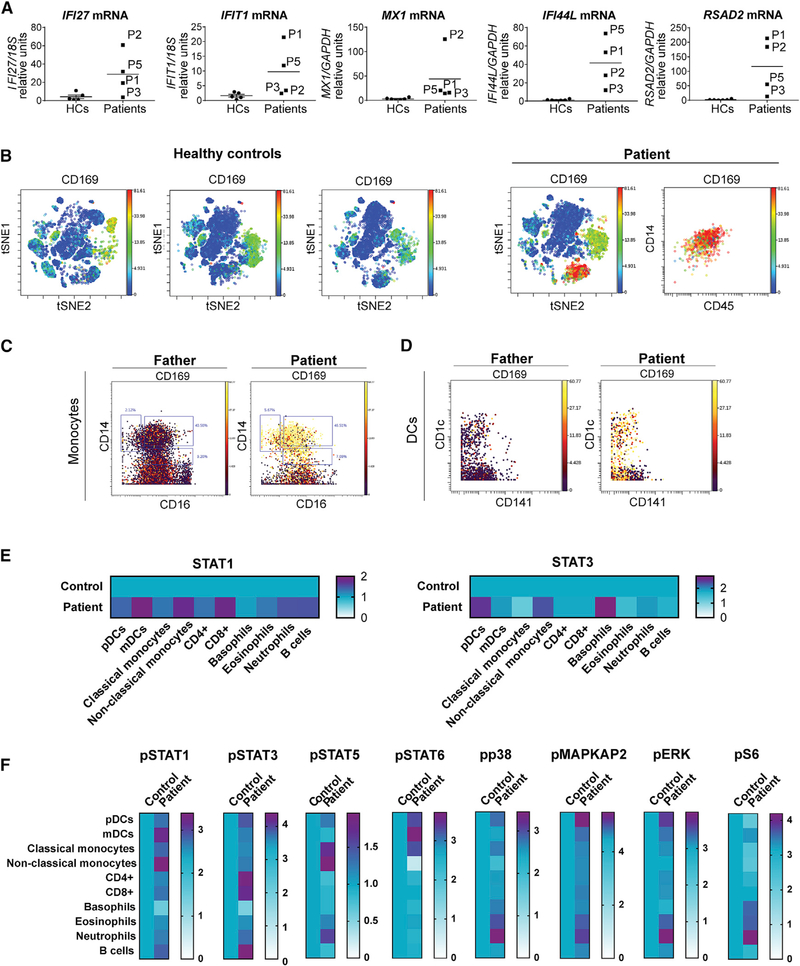
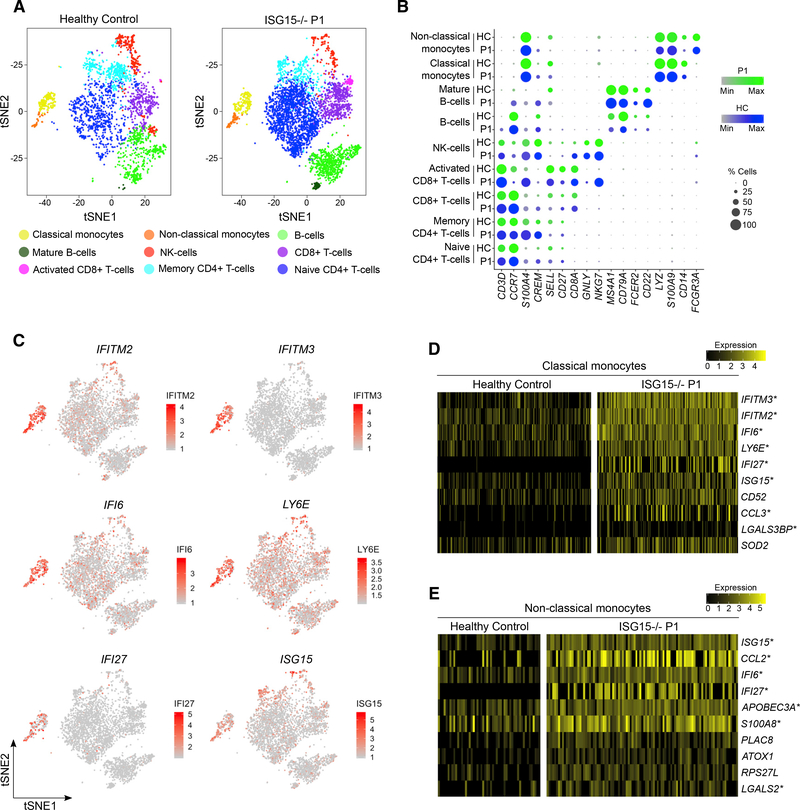
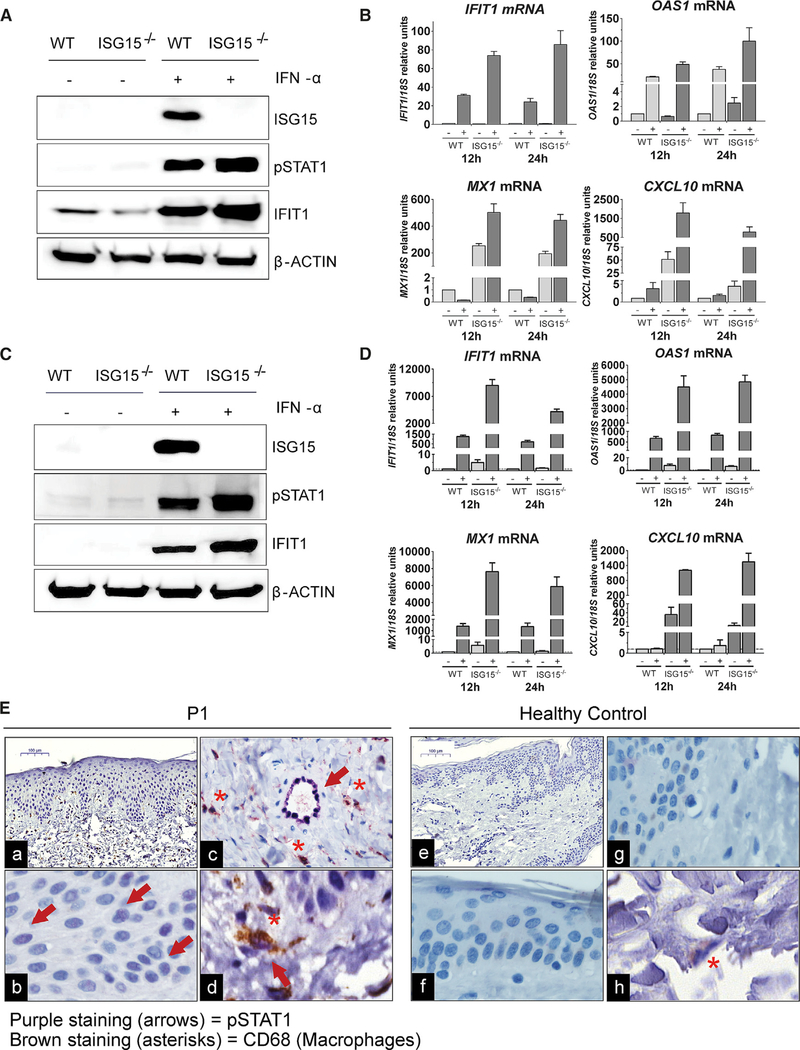
Most monogenic disorders have a primary clinical presentation. Inherited ISG15 deficiency, however, has manifested with two distinct presentations to date: susceptibility to mycobacterial disease and intracranial calcifications from hypomorphic interferon-II (IFN-II) production and excessive IFN-I response, respectively. Accordingly, these patients were managed for their infectious and neurologic complications. Herein, we describe five new patients with six novel ISG15 mutations presenting with skin lesions who were managed for dermatologic disease. Cellularly, we denote striking specificity to the IFN-I response, which was previously assumed to be universal. In peripheral blood, myeloid cells display the most robust IFN-I signatures. In the affected skin, IFN-I signaling is observed in the keratinocytes of the epidermis, endothelia, and the monocytes and macrophages of the dermis. These findings define the specific cells causing circulating and dermatologic inflammation and expand the clinical spectrum of ISG15 deficiency to dermatologic presentations as a third phenotype co-dominant to the infectious and neurologic manifestations.

Keywords: ISG15; Mendelian susceptibility to mycobacterial disease; USP18; endothelial cells; inborn errors of immunity; keratinocytes; myeloid cells; skin inflammation; type I interferonopathy.


Conflict of interest statement

Declaration of Interests The authors declare no competing interests.

Figures

Figure 1.
Figure 1.. Identification of Five Patients and Six Different Mutations of ISG15
(A) Familial segregations of the ISG15 alleles. Family 1 includes one affected child (P1) carrying compound heterozygous variants (c.310G>A and c.352C>T) and one unaffected sibling. Family 2 includes two affected children (P2 and P3) with a splice-site variant (c.4–1G>A). Family 3 includes one affected child (P4) with compound heterozygous variants (c.83T>A and c.284del). Family 4 includes one affected child (P5) with compound heterozygous variants (c.284del and c.297_313del). The corresponding genotypes are indicated. (B) Skin lesions from P1 (a and b) and P4 (c and d). (C) Schematic localization of the ISG15 variants in the genomic DNA, indicated by the red arrows. (D) Predicted localization of the four amino acid substitutions in the three-dimensional (3D) model of ISG15.
Figure 2.
Figure 2.. Allele Characterization
(A) HEK293T cells were transfected with a plasmid encoding the various ISG15 variants: luciferase (Luc), wild-type ISG15 (WT), c.310G>A, c.352C>T, c.83T>A, c.284del ISG15, and c.297_313del. Relative mRNA levels for ISG15 assessed by qRT-PCR, performed three times for each variant, with technical triplicates; the data for a representative experiment (n = 3) are shown. (B) HEK293T cells were transfected with a plasmid encoding the various ISG15 variants: Luciferase (Luc), wild-type ISG15 (ISG15), c.310G>A, or c.352C>T ISG15. Cell lysates were analyzed by western blotting for ISG15; a representative experiment is shown. (C) HEK293T cells were transfected with a plasmid encoding the various ISG15 variants: Luciferase (Luc), wild-type ISG15 (ISG15), c.83T>A, or c.284del ISG15. Cell lysates were analyzed by western blotting for ISG15; a representative experiment is shown. (D) HEK293T cells were transfected with a plasmid encoding the various ISG15 variants: Luciferase (Luc), wild-type ISG15 (ISG15), or c.297_313del ISG15. Cell lysates were analyzed by western blotting for ISG15; a representative experiment is shown. (E) RNA was isolated from P2 and P3 and subjected to 3’RACE analysis. Schematic diagram of the ISG15 amplicons obtained on 3’RACE RT-PCR. (F) 3′ RACE amplicons were inserted into a TOPO vector for the quantification of each splicing variant. In total, 26 colonies per patient were grown and sequenced. The graph shows the percentage of each of the three splicing variants identified. (G) hTert-immortalized fibroblasts from a control donor (Control), P2, or P3 were treated with 1,000 U/mL of IFN-α2b for 24 h. Cell lysates were analyzed by western blotting with the indicated antibodies; data for a representative experiment are shown. (H) HEK293T cells were transfected with a constant amount of wild-type USP18 (WT) together with various amounts of the different variants of ISG15 (WT or c.310G>A). Cell lysates were analyzed by western blotting with the indicated antibodies. (I) HEK293T cells were transfected with a constant amount of wild-type USP18 (WT) together with various amounts of the different variants of ISG15 (WT, c.284del, or c.83T>A). Cell lysates were analyzed by western blotting with the indicated antibodies. (J) Epstein-Barr virus (EBV)-transformed B cells from a control donor or P1 were stimulated with 1,000 U/mL IFN-α2b for 24 h. Cell lysates were analyzed by western blotting with the indicated antibodies; data from a representative experiment are shown. (K) hTert-immortalized fibroblasts from a control or an ISG15-deficient patient were transduced with luciferase, WT ISG15, or c.310G>A ISG15 and sorted. These fibroblasts were treated with 1,000 U/mL IFN-α2bfor 12 h, washed with PBS, and left to rest for 36 h, after which relative mRNA levels were determined for MX1, three times for each individual, with technical triplicates; a representative experiment is shown. Bars represent the mean ± SD.
Figure 3.
Figure 3.. Monocytes and Dendritic Cells in the Blood Drive Type I Interferonopathy in Patients with ISG15 Mutations
(A) Relative mRNA levels for IFIT1, MX1, RSAD2, IFI44L, and IFI27 in peripheral blood from a healthy control, P1,P2, P3, and P5, as assessed by qRT-qPCR. Bars represent the mean ± SD. (B) PBMCs from patients and healthy controls were immunophenotyped by CyTOF technology with a 40-marker panel. t-Stochastic neighbor embedding (t-SNE) plot of PBMCs from P1 and three healthy controls, showing SIGLEC1 (CD169) expression in the various immune populations. The monocyte compartment displays high levels of SIGLEC1 (CD169) expression in P1. (C) SIGLEC1 (CD169) expression in the various subtypes of monocytes (CD14+CD16, CD14+CD16+, and CD14CD16+). (D) SIGLEC1 (CD169) expression in dendritic cells. (E) PBMCs from P1 and a control were analyzed by CyTOF. with a panel including several activated signaling markers. Heatmaps show the median expression levels of STAT1 and STAT3 in P1 relative to a healthy control, for the various immune cell subtypes. (F) PBMCs from P1 and a control were analyzed by CyTOF. with a panel including several activated signaling markers. Heatmaps show the median expression levels of pSTAT1, pSTAT3, pSTAT5, pSTAT6, pp38, pMAPKAP2, pERK, and pS6 in P1 relative to a healthy control, for the various immune cell subtypes.
Figure 4.
Figure 4.. ScRNA-Seq of ISG15−/− PBMCs Reveals Monocyte-Driven ISG Expression
(A) Single-cell RNA sequencing was performed on PBMCs isolated from P1 and a healthy control, with the Chromium Platform from 10X Genomics. tSNE plots were generated by unbiased clustering and manual curation of immune cell subsets by cluster-specific genes. (B) Bubble plots displaying the cell type markers identifying each cluster in the patient (green) and control (blue) data, with the color intensity representing scaled expression and the bubble size representing the percentage of cells expressing the transcript. (C) Expression of representative ISGs (IFITM2, IFITM3, IFI6, LY6E, IFI27, and ISG15) in patient PBMCs, showing strong localization to monocytes. (D) Heatmap of the top ten genes most strongly upregulated (mean cluster expression with log[fold change] > 0.25) in the patient’s classical monocytes relative to those of a healthy control. (E) Heatmap of the top ten genes most strongly upregulated (log[fold change] > 0.25) in the patient’s non-classical monocytes relative to those of the healthy control. Columns represent expression levels in individual captured cells. Asterisk indicates well-documented interferon-stimulated genes.
Figure 5.
Figure 5.. IFN-I Dysregulation in Skin, Vascular Endothelial Cells, and Infiltrating Myeloid Cells
(A) CRISPR was used to knock out ISG15 in HaCaT cells. The cells were stimulated with 1,000 U/mL IFN-α2b for 24 h. Cells were lysed, and the lysates were analyzed by western blotting with the indicated antibodies; the results of a representative experiment are shown. (B) WT and ISG15-KO HaCaT cells were stimulated with 1,000 U/mL IFN-α2b for 12 and 24 h. Relative mRNA levels for IFIT1, MX1, OAS1, and CXCL10 were assessed by qRT-qPCR. Bars represent the mean ± standard error of the mean (SEM). (C) Human WT and ISG15-deficient iPSCs were differentiated to develop into endothelial cells and stimulated with 1,000 U/mLIFN-α2b for 24 h. Cell lysates were analyzed by western blotting with the indicated antibodies; data from a representative experiment are shown. (D) WT and ISG15-deficient endothelial cells were stimulated with 1,000 U/mL IFN-α2b for 12 and 24 h. Relative mRNA levels for IFIT1, MX1, OAS1, and CXCL10 were determined by qRT-qPCR. Bars represent the mean ± SEM. (E) Representative H&E staining and staining for pSTAT1 (purple) and CD68 (brown) immunohistochemistry (IHC) results for skin biopsies from P1 and a healthy control. Original magnification: 10× (a and e), 40× (b-d, f, and g). Arrows indicate pSTAT1+ cells. Asterisks indicate CD68+ cells (macrophage infiltration).

References

    1. Alsohime F, Martin-Fernandez M, Temsah MH, Alabdulhafid M, Le Voyer T, Alghamdi M, Qiu X, Alotaibi N, Alkahtani A, Buta S, et al. (2020). JAK inhibitor therapy in a child with inherited USP18 deficiency. N. Engl. J. Med. 382, 256–265. - PMC - PubMed
    1. Bogunovic D, Byun M, Durfee LA, Abhyankar A, Sanal O, Mansouri D, Salem S, Radovanovic I, Grant AV, Adimi P, et al. (2012). Mycobacterial disease and impaired IFN-γ immunity in humans with inherited ISG15 deficiency. Science 337, 1684–1688. - PMC - PubMed
    1. Boukamp P, Petrussevska RT, Breitkreutz D, Hornung J, Markham A, and Fusenig NE (1988). Normal keratinization in a spontaneously immortalized aneuploid human keratinocyte cell line. J. Cell Biol. 106, 761–771. - PMC - PubMed
    1. Broderick L (2019). Hereditary autoinflammatory disorders: recognition and treatment. Immunol. Allergy Clin. North Am. 39, 13–29. - PubMed
    1. Bustamante J (2020). Mendelian susceptibility to mycobacterial disease: recent discoveries. Hum. Genet 10.1007/s00439-020-02120-y. - DOI - PMC - PubMed

Publication types

MeSH terms

LinkOut - more resources