. 2020 May 12;31(6):107623.
doi: 10.1016/j.celrep.2020.107623.

Glucose Response by Stem Cell-Derived β Cells In Vitro Is Inhibited by a Bottleneck in Glycolysis

Affiliations

Glucose Response by Stem Cell-Derived β Cells In Vitro Is Inhibited by a Bottleneck in Glycolysis

Jeffrey C Davis et al. Cell Rep. .

Abstract

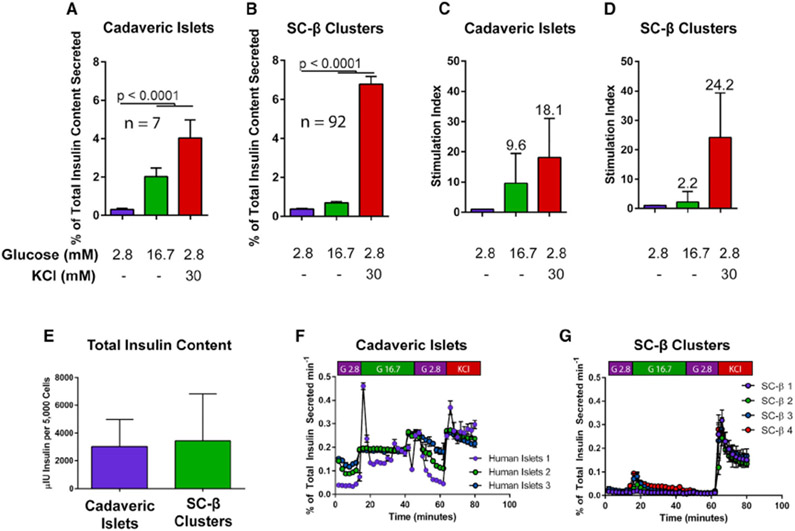
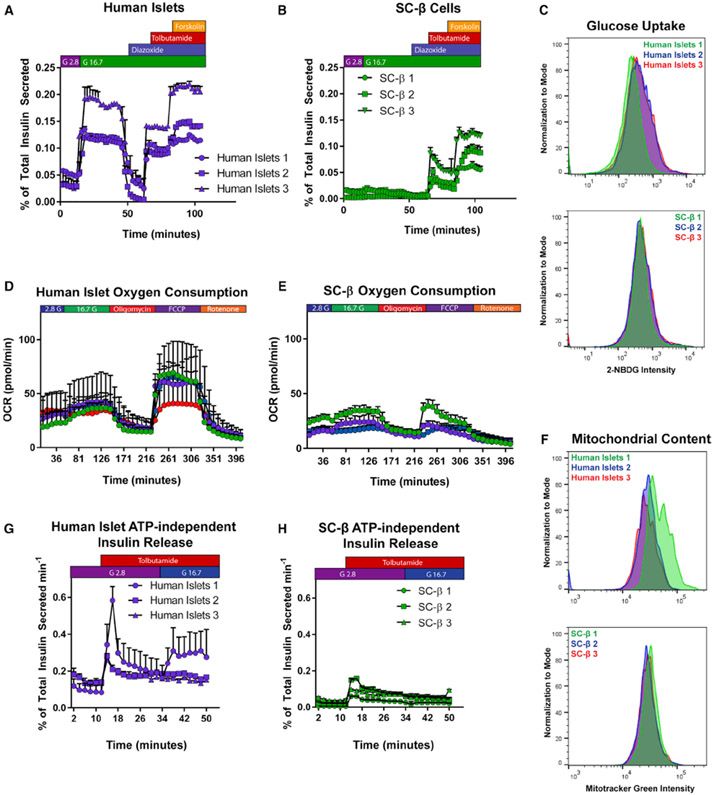
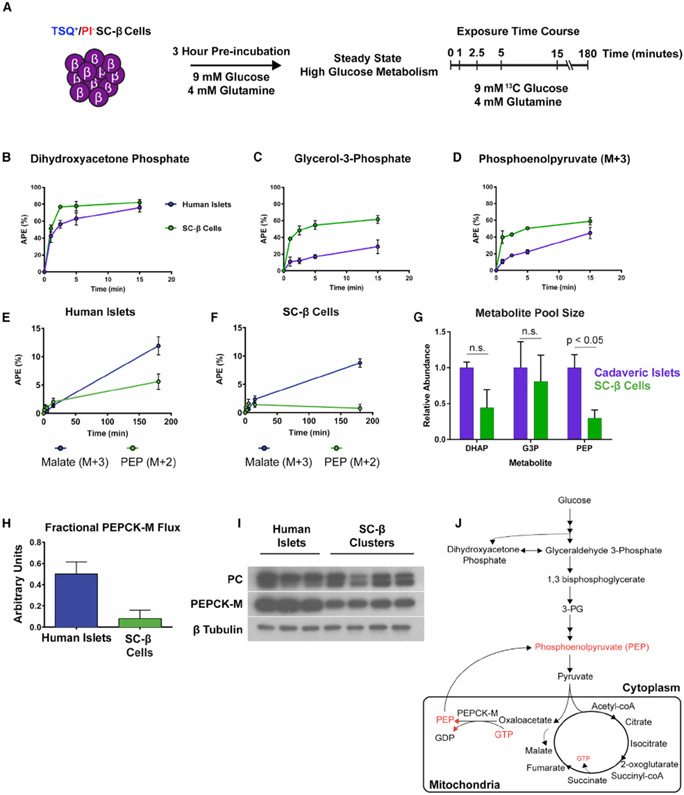
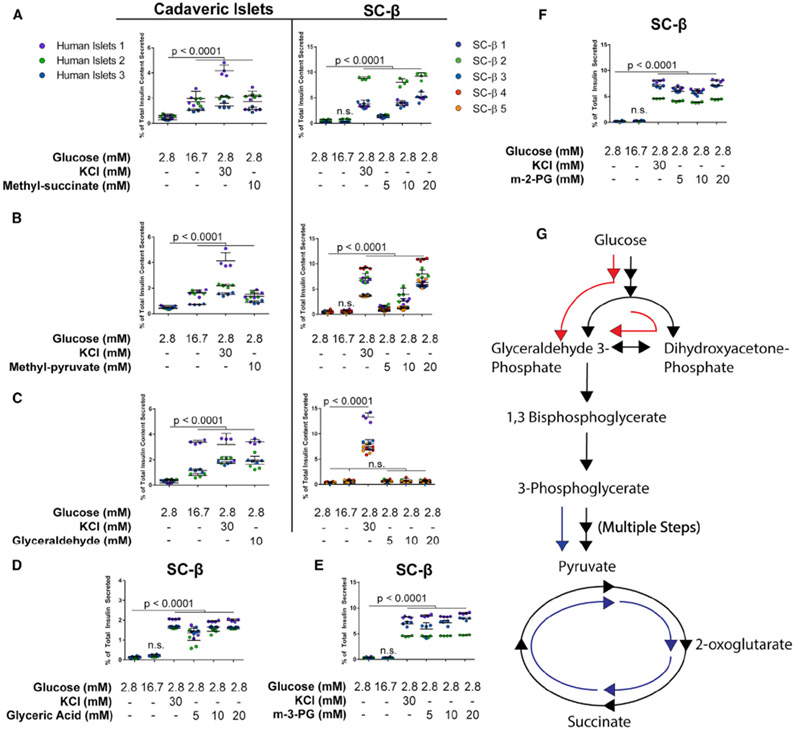
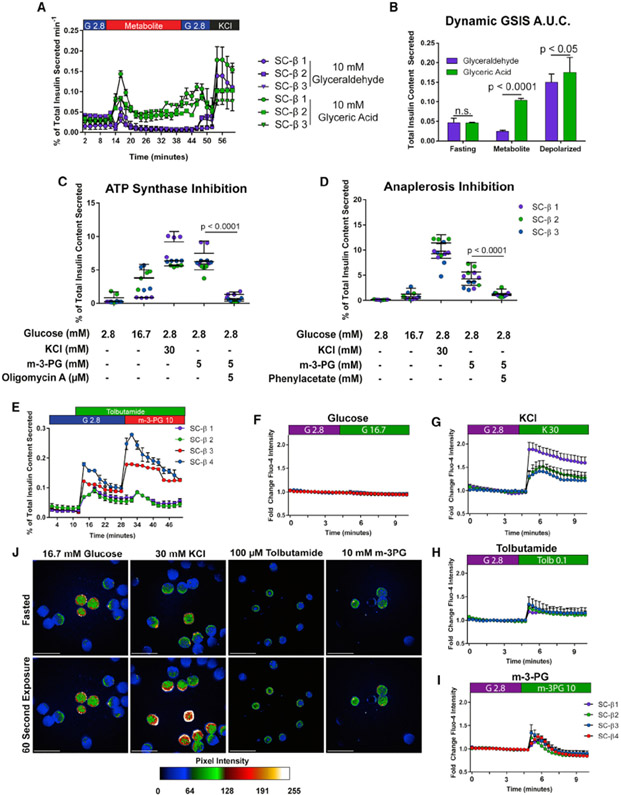
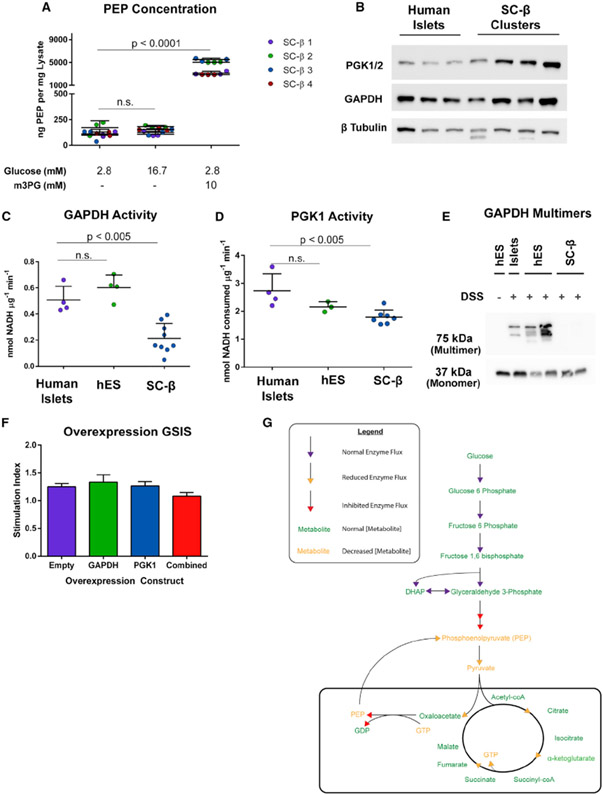
Stem cell-derived β (SC-β) cells could provide unlimited human β cells toward a curative diabetes treatment. Differentiation of SC-β cells yields transplantable islets that secrete insulin in response to glucose challenges. Following transplantation into mice, SC-β cell function is comparable to human islets, but the magnitude and consistency of response in vitro are less robust than observed in cadaveric islets. Here, we profile metabolism of SC-β cells and islets to quantify their capacity to sense glucose and identify reduced anaplerotic cycling in the mitochondria as the cause of reduced glucose-stimulated insulin secretion in SC-β cells. This activity can be rescued by challenging SC-β cells with intermediate metabolites from the TCA cycle and late but not early glycolysis, downstream of the enzymes glyceraldehyde 3-phosphate dehydrogenase and phosphoglycerate kinase. Bypassing this metabolic bottleneck results in a robust, bi-phasic insulin release in vitro that is identical in magnitude to functionally mature human islets.

Keywords: GSIS; MIMOSA; differentiation; glucose-stimulated insulin secretion; metabolic profiling; stem cell metabolism; stem cell-derived β cell; β-cell metabolism.


Conflict of interest statement

Declaration of Interests D.A.M. is the scientific founder of and an adviser for Semma Therapeutics and serves on the board of directors (BOD) of Blue Bird Bio.

Figures

Figure 1.
Figure 1.. Insulin Secretion Profiles in SC-β Cells
(A and B) Glucose response profile of human cadaveric islets (n = 7) (A) and differentiated SC-β cells (n = 92) (B) challenged with low glucose (2.8 mM), high glucose (16.7 mM), or KCl (30 mM) in low-glucose buffer for 60 min. (C and D) Stimulation index of cadaveric islets (C) and SC-β cells (D) after glucose or KCl challenge. Stimulation indices are indicated above each column. (E) Total insulin content profile of human cadaveric islets and SC-β cells (n = 7 and 24 for human islets and SC-β cells, respectively). (F and G) Dynamic perifusion insulin secretion profile of cadaveric islets (n = 3) (F) and SC-β cells (n = 4) (G). Statistical analysis was carried out using two-way ANOVA with Dunnett’s correction for multiple hypothesis testing. For all experiments shown, color denotes a unique biological replicate within an experiment. Replicates within a biological group are the same color. Data are represented as mean ± SD.
Figure 2.
Figure 2.. Analysis of SC-β Cell Secretory Machinery
(A and B) Dynamic perifusion of human cadaveric islets (A) or SC-β cells (B) with glucose (G2.8 = 2.8 mM glucose; G16.7 = 16.7 mM glucose), insulin secretion modifiers added for the durations shown above (diazoxide and tolbutamide used at 100 μM, forskolin at 10 μM). Each set of data points is a biological replicate. (C) Uptake of fluorescent glucose analog 2-NBDG after 15-min incubation in TSQ+ cells of human cadaveric islets (above) and SC-β cells (below). (D and E) Oxygen consumption profile of human cadaveric islets (n = 4) (D) and SC-β cells (n = 3) (E). (F) Mitotracker Green dye uptake in human cadaveric islets (above) and SC-β cells (below). (G and H) ATP-independent insulin secretion in dynamic perifusion of cadaveric islets (G) or SC-β cells (H). For all experiments shown, individually labeled samples in a legend or separate colors within a graph denote a unique biological replicate within an experiment. Data are represented as mean ± SD.
Figure 3.
Figure 3.. MIMOSA Metabolomic Profiling of SC-β Cells
(A) Outline of experimental protocol for metabolomic profiling using MIMOSA, starting with reaggregates of SC-β cells sorted for TSQ and propidium iodide (PI) fluorescence. (B–D) Atomic percent enrichment (APE) of 13C in dihydroxyacetone phosphate (B), glycerol-3-phosphate (C), and phosphoenol pyruvate (PEP) (D). (E and F) APE of malate M+3 (Purple) and PEP M+2 (Green) in cadaveric islets (E) and SC-β cells (F). (G) Dihydroxyacetone phosphate (DHAP), glycerol-3-phosphate (G3P), and PEP pool size in cadaveric islets (purple) and SC-β clusters (green). (H) Adjusted PEPCK-M activity to PEP metabolite pool size. (I) Western blot for pyruvate carboxylase (PC) and PEPCK-M enzyme expression. Images from the same experiment at different exposures per blot were edited together for ease of presentation. (J) Summary of results from MIMOSA metabolomic profiling. Metabolites in red are inferred to be decreased from MIMOSA analysis. Statistical analysis in (G) was performed using a two-way ANOVA with Sidak’s multiple-comparisons test. Error bars represent SEM. Data are represented as mean ± SEM.
Figure 4.
Figure 4.. Some Cell-Permeable Intermediates Drive Insulin Secretion in SC-β Cells
Intermediate metabolite insulin secretion responses for cadaveric islets and SC-β cells. Cadaveric islets or differentiated SC-β cells were dissociated and reaggregated for 48–72 h before 1-h incubation in indicated conditions after a 2-h fast at 2.8 mM glucose. (A) Mono-methyl succinate response profiles in cadaveric islets (left) and SC-β cells (right). (B and C) Response profiles to methyl-pyruvate (B) and glyceraldehyde (C) in cadaveric islets and SC-β cells. (D) SC-β response to glycerate. (E) SC-β response to methyl-3-phosphoglyerate (m-3-PG). (F) SC-β response to methyl-2-phosphoglyerate (m-2-PG). (G) Schematic representation of metabolite effects on SC-β cell insulin secretion. Metabolites entering the TCA cycle or late glycolysis successfully induce insulin release (blue arrows). Cell-permeable metabolites of early glycolysis or glucose itself generate a much smaller magnitude of insulin release (red arrows). Data points are individual replicate values. Colors denote separate batches of differentiated cells, treated as biological replicates. The p values were calculated using a two-way ANOVA with Dunnett’s multiple testing correction. For all experiments shown, color denotes a unique biological replicate within an experiment. Replicates within a biological group are the same color. Data are represented as mean ± SD.
Figure 5.
Figure 5.. Metabolic Stimulation of Glycolysis Drives Physiological Insulin Secretion in SC-β Cells
(A) Dynamic perifusion of SC-β cells with 10 mM glyceric acid (green) or 10 mM glyceraldehyde (purple). G2.8 and G16.7 refer to 2.8 and 16.7 mM glucose, respectively. (B) Area under the curve from dynamic GSIS data in (A). (C) Insulin secretion stimulated by m-3-PG is ablated by inhibition of ATP synthase using oligomycin A. (D) Blocking anaplerotic pyruvate carboxylase activity using phenylacetate disrupts m-3-PG effect on insulin secretion. (E) ATP-independent insulin secretion is also stimulated in SC-β cells using m-3-PG. (F–I) Calcium flux in TSQ-enriched SC-β cells after high glucose (F), low glucose with 30 mM KCl (G), 100 μM tolbutamide (H), or 10 mM m-3-PG (I). (J) Images from Fluo-4 signal during fasting (top row) and 20 s after exposure with the indicated KRB solution (bottom row). Scale bars represent 500 μm. The p values for (B), (C), and (D) were calculated using a two-way ANOVA with Dunnett’s multiple hypothesis correction. For all experiments shown, color denotes a unique biological replicate within an experiment. Replicates within a biological group are the same color. Data are represented as mean ± SD. In (A), each labeled sample is a biological replicate from a separate differentiation.
Figure 6.
Figure 6.. Activity of GAPDH Is Perturbed in SC-β Cells
(A) Quantification of cellular PEP in different GSIS conditions from SC-islets. (B) Western blot of lysates from differentiated SC-β cells and cadaveric islets for GAPDH and PGK1. These human islet lysates were from samples used in GAPDH and PGK activity assays. Each band is a separate preparation of human islets or differentiation of SC-β cells. (C) GAPDH enzyme activity in cadaveric islets, undifferentiated human embryonic stem cells (hES), and differentiated SC-β cells. (D) PGK activity in cadaveric islets, undifferentiated hES cells, and differentiated SC-β cells. (E) GAPDH western blot of lysates from DSS-cross-linking in primary islets, hES cells, and differentiated SC-β cells. (F) GSIS on GAPDH and PGK1-overexpressing SC-β cells. (G) Model of SC-β cell inhibition of GSIS caused by decreased GAPDH activity underlying decreased PEP flux. The p values were calculated using two-way ANOVA with Dunnett’s multiple hypothesis correction. For all experiments shown, color denotes a unique biological replicate within an experiment. Replicates within a biological group are the same color. Each data point in (C) and (D) represents a unique biological replicate for human islets (separate donors), SC-β cells (separate differentiations), and hES cells (different passages). Spaces in western blot panels indicate where images from the same experiment were edited together for ease of presentation. Data are represented as mean ± SD.

References

    1. Alves TC, Pongratz RL, Zhao X, Yarborough O, Sereda S, Shirihai O, Cline GW, Mason G, and Kibbey RG (2015). Integrated, step-wise, mass-isotopomeric flux analysis of the TCA cycle. Cell Metab. 22, 936–947. - PMC - PubMed
    1. Atkinson MA, Eisenbarth GS, and Michels AW (2014). Type 1 diabetes. Lancet 383, 69–82. - PMC - PubMed
    1. Bahl JJ, Matsuda M, DeFronzo RA, and Bressler R (1997). In vitro and in vivo suppression of gluconeogenesis by inhibition of pyruvate carboxylase. Biochem. Pharmacol 53, 67–74. - PubMed
    1. Bentsi-Barnes K, Doyle ME, Abad D, Kandeel F, and Al-Abdullah I (2011). Detailed protocol for evaluation of dynamic perifusion of human islets to assess β-cell function. Islets 3, 284–290. - PMC - PubMed
    1. Bonner-Weir S, Deery D, Leahy JL, and Weir GC (1989). Compensatory growth of pancreatic beta-cells in adult rats after short-term glucose infusion. Diabetes 38, 49–53. - PubMed

Publication types