. 2020 May 11;10(5):58.
doi: 10.3390/life10050058.

High-Throughput Identification of MiR-145 Targets in Human Articular Chondrocytes

Affiliations

High-Throughput Identification of MiR-145 Targets in Human Articular Chondrocytes

Aida Martinez-Sanchez et al. Life (Basel). .

Abstract

MicroRNAs (miRNAs) play key roles in cartilage development and homeostasis and are dysregulated in osteoarthritis. MiR-145 modulation induces profound changes in the human articular chondrocyte (HAC) phenotype, partially through direct repression of SOX9. Since miRNAs can simultaneously silence multiple targets, we aimed to identify the whole targetome of miR-145 in HACs, critical if miR-145 is to be considered a target for cartilage repair. We performed RIP-seq (RNA-immunoprecipitation and high-throughput sequencing) of miRISC (miRNA-induced silencing complex) in HACs overexpressing miR-145 to identify miR-145 direct targets and used cWords to assess enrichment of miR-145 seed matches in the identified targets. Further validations were performed by RT-qPCR, Western immunoblot, and luciferase assays. MiR-145 affects the expression of over 350 genes and directly targets more than 50 mRNAs through the 3'UTR or, more commonly, the coding region. MiR-145 targets DUSP6, involved in cartilage organization and development, at the translational level. DUSP6 depletion leads to MMP13 upregulation, suggesting a contribution towards the effect of miR-145 on MMP13 expression. In conclusion, miR-145 directly targets several genes involved in the expression of the extracellular matrix and inflammation in primary chondrocytes. Thus, we propose miR-145 as an important regulator of chondrocyte function and a new target for cartilage repair.

Keywords: RNA-immunoprecipitation; cartilage; chondrocyte; miRNAs.


Conflict of interest statement

The authors declare no conflict of interest.

Figures

Figure 1
Figure 1
Immunoblotting analysis of human articular chondrocyte (HAC) lysates following transfection with miR-145 mimics. HACs were transfected with control (C) or miR-145 (145) mimics and immunoprecipitation was performed with an anti-Ago2 antibody (Ago2) or an IgG control, as indicated. I (Input): 2.5% of the total lysate submitted to immunoprecipitation (IP); FT (Flow-through): 5% of the extract recovered after IP. (A) Samples were separated by SDS-PAGE and proven with the anti-Ago2 antibody to determine the presence of Ago proteins. (B) MiR-145 bound to Ago2 following immunoprecipitation, in comparison with IgG, was estimated by RT-qPCR. MiR-145 overexpression resulted in ~40 fold increased in the amount of miR-145 bound to Ago2.
Figure 2
Figure 2
Enrichment of miR-145 seed sites in the CDSs (A,B) or 3′UTRs (C,D) of the precipitated mRNAs. (A,C) Scatter plot showing the maxima of enrichment profile. Each dot represents a word, the Y-position reflects the maximum score of an enriched word and X-position shows the gene-index where the Z-score is maximum. Top-ranked words with a left-shift associate with gene-expression change (lower gene index represents a stronger upregulation in Ago2 upon miR-145 transfection). Triangles annotate known seed sites of human miRNAs, red triangles show miR-145 seed sites. (B,D) Word-enrichment profile: The line plot shows enrichment through the gene rank for the top ten enriched words. Each line represents the running sum over all scores that quantify a degree of enrichment according to gene upregulation (from most upregulated to most downregulated).
Figure 3
Figure 3
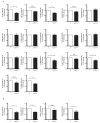
Luciferase reporter assays to validate a miR-145 direct effect on the expression of selected genes. Hela cells were transfected with luciferase reporters containing full-length CDSs or 3′UTRs, or both, of 12 randomly selected mRNAs from Di-IP, as indicated, downstream the firefly luciferase ORF. Control (white bars) or miR-145 (black bars) mimics were cotransfected in the cells. Values are normalized to the levels of renilla luciferase, independently expressed by the same vector and are shown as relative to that obtained for each construct cotransfected with the control miRNA mimic (± SEM). As positive control, a construct containing three perfectly complementary binding sites for miR-145 (3 x miR-145) was included in the experiment. * p < 0.05; **** p < 0.0001; ns: Not significant.
Figure 4
Figure 4
Analysis of the effect of miR-145 overexpression on mRNA levels of selected genes in freshly isolated HACs. (A) Sixteen randomly selected mRNAs from Di-IP and CD2DB1 from both Di-IP and DownT-RNA. (B) Three genes only present in DownT-RNA and COL2A1. Control (C) or miR-145 mimics were transfected in freshly isolated HACs and RNA was extracted 48 h after transfection. Values are presented as relative to that obtained in cells transfected with control mimics for each patient and normalized to RPLP0. Data represents average ± SEM from seven different experiments, each performed with different donor cells (19 yo. female; 8 yo. male; 28 yo. male; 45 yo. male; 16 yo. male; 13 yo. female; 31 yo. female). * p < 0.05; ** p < 0.01; *** p < 0.001; ns: Not significant.
Figure 5
Figure 5
MiR-145 directly represses DUSP6. Western blot showing reduced DUSP6 levels following miR-145 overexpression in P2 (A) and freshly isolated (B) HACs. (C) Western blot showing increased DUSP6 levels following miR-145 inhibition in freshly isolated HACs. DUSP6 protein bands were quantified by densitometry and are normalized against tubulin and expressed relative to the control (± SEM). * p < 0.05, ** p < 0.01 (A, right hand side panel, B and C, lower panels). In all experiments HACs were transfected with a relevant control (C) or miR-145 precursor or inhibitor, and subsequently cultured in 20% or, where indicated, 1% O2 tension for 44 h. (D) Hela cells were transfected with luciferase reporters containing three perfectly complementary binding sites for miR-145 (3 x miR-145), the DUSP6 3′UTR containing a putative miR-145 binding site (seed matching nucleotides 1018 to 1025; DUSP6 3′UTR), or a mutated seed-matching site (DUSP6 3′UTR miR-145 MUT) downstream the firefly luciferase open reading frame (ORF). Control (‘C’) or miR-145 mimics were cotransfected in the cells. Values were normalized to the levels of renilla luciferase, independently expressed by the same vector and are shown as relative to that obtained for each construct cotransfected with the control miRNA mimic (± SEM). **** p < 0.0001.
Figure 6
Figure 6
DUSP6 depletion results in MMP13 upregulation. (A) RT-qPCR analysis of DUSP6 and MMP13 levels after transfection of P2 HACs with 5 nM DUSP6 siRNA. Values are presented as relative to that obtained in cells transfected with control siRNA for each patient and normalized to RPLP0. Data represents average ± SEM from four different experiments, each performed with different donor cells (11 yo. male; 47 yo. male; 65 yo. male; 51 yo. male). * p < 0.05; ** p < 0.01; **** p < 0.0001. (B,C) Western blot showing ERK phosphorylation (pERK) after treatment with FGF2 (25 nM). Total ERK (ERK) is shown as a loading control. P1 HACs were transfected with control (C) or miR-145 (145) mimics (B), or control (C) or DUSP6 siRNAs (#1, #2, notice than only #2 siRNA results in DUSP6 depletion, therefore #1 acts as an additional control) (C). After 24 h, HACs were placed in a serum-free medium overnight and stimulated with 25 nM FGF2 for the indicated times. These experiments were performed three times, with three different donors; one representative experiment is shown.

Similar articles

Cited by

References

    1. Billinghurst R.C., Dahlberg L., Ionescu M., Reiner A., Bourne R., Rorabeck C., Mitchell P., Hambor J., Diekmann O., Tschesche H., et al. Enhanced cleavage of type II collagen by collagenases in osteoarthritic articular cartilage. J. Clin. Investig. 1997;99:1534–1545. doi: 10.1172/JCI119316. - DOI - PMC - PubMed
    1. Woodell-May J.E., Sommerfeld S.D. Role of Inflammation, and the Immune System in the Progression of Osteoarthritis. J. Orthop. Res. 2020;38:253–257. doi: 10.1002/jor.24457. - DOI - PubMed
    1. Wang X., Manner P.A., Horner A., Shum L., Tuan R.S., Nuckolls G.H. Regulation of MMP-13 expression by RUNX2 and FGF2 in osteoarthritic cartilage. Osteoarthr. Cartil. 2004;12:963–973. doi: 10.1016/j.joca.2004.08.008. - DOI - PubMed
    1. Caldwell K.L., Wang J. Cell-based articular cartilage repair: The link between development and regeneration. Osteoarthr. Cartil. 2015;23:351–362. doi: 10.1016/j.joca.2014.11.004. - DOI - PMC - PubMed
    1. Dreier R. Hypertrophic differentiation of chondrocytes in osteoarthritis: The developmental aspect of degenerative joint disorders. Arthritis Res. Ther. 2010;12:216. doi: 10.1186/ar3117. - DOI - PMC - PubMed