

Probing Nanoelectroporation and Resealing of the Cell Membrane by the Entry of Ca2+ and Ba2+ Ions
- PMID: 32403282
- PMCID: PMC7247012
- DOI: 10.3390/ijms21093386
Probing Nanoelectroporation and Resealing of the Cell Membrane by the Entry of Ca2+ and Ba2+ Ions
Abstract
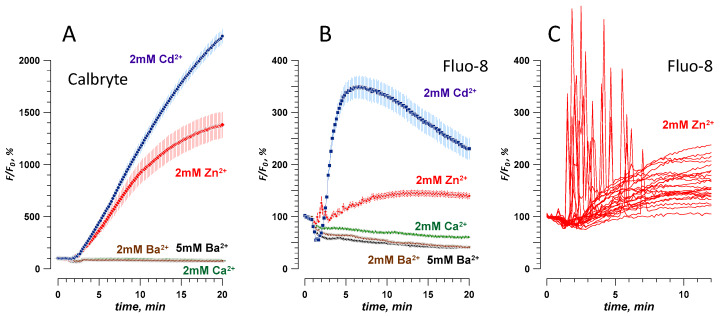
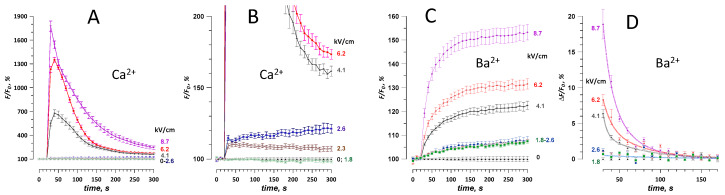
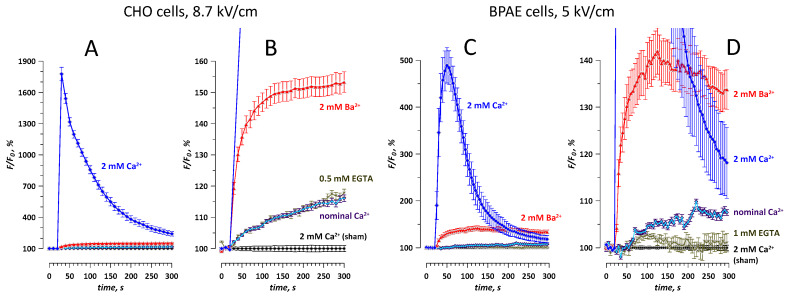
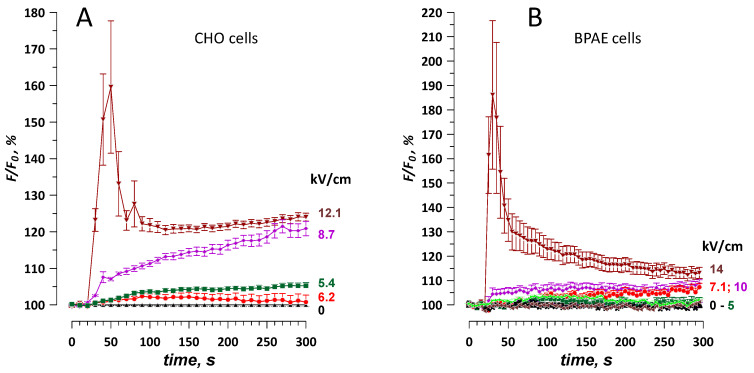
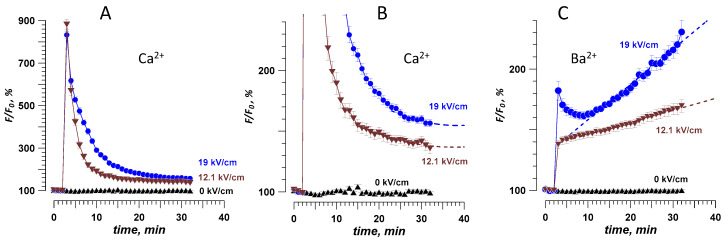
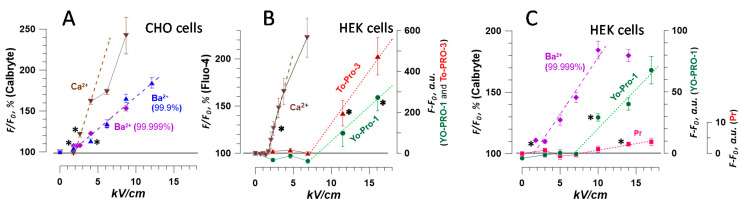
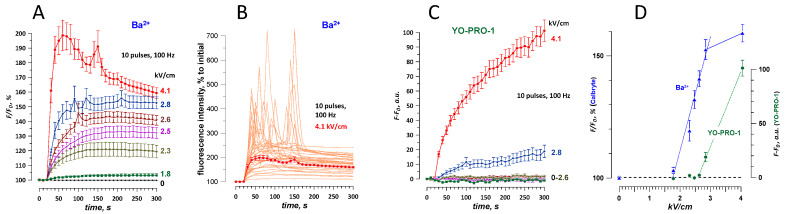
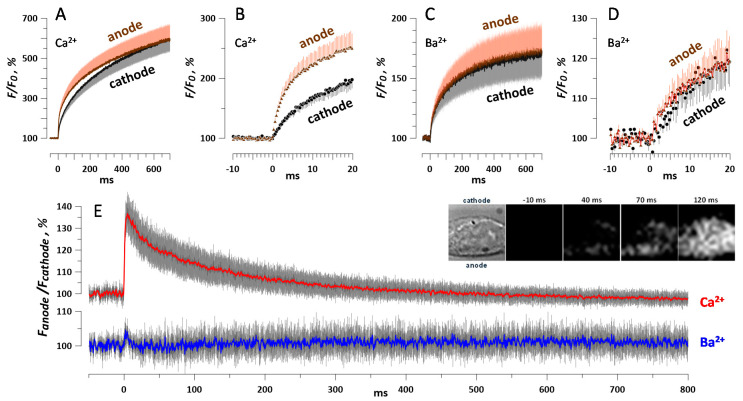
The principal bioeffect of the nanosecond pulsed electric field (nsPEF) is a lasting cell membrane permeabilization, which is often attributed to the formation of nanometer-sized pores. Such pores may be too small for detection by the uptake of fluorescent dyes. We tested if Ca2+, Cd2+, Zn2+, and Ba2+ ions can be used as nanoporation markers. Time-lapse imaging was performed in CHO, BPAE, and HEK cells loaded with Fluo-4, Calbryte, or Fluo-8 dyes. Ca2+ and Ba2+ did not change fluorescence in intact cells, whereas their entry after nsPEF increased fluorescence within <1 ms. The threshold for one 300-ns pulse was at 1.5-2 kV/cm, much lower than >7 kV/cm for the formation of larger pores that admitted YO-PRO-1, TO-PRO-3, or propidium dye into the cells. Ba2+ entry caused a gradual emission rise, which reached a stable level in 2 min or, with more intense nsPEF, kept rising steadily for at least 30 min. Ca2+ entry could elicit calcium-induced calcium release (CICR) followed by Ca2+ removal from the cytosol, which markedly affected the time course, polarity, amplitude, and the dose-dependence of fluorescence change. Both Ca2+ and Ba2+ proved as sensitive nanoporation markers, with Ba2+ being more reliable for monitoring membrane damage and resealing.
Keywords: electropermeabilization; electroporation; membrane integrity; membrane repair; nanopores; nsEP; nsPEF.
Conflict of interest statement
The authors declare no conflict of interest.
Figures
Similar articles
-
The interplay of excitation and electroporation in nanosecond pulse stimulation.Bioelectrochemistry. 2020 Dec;136:107598. doi: 10.1016/j.bioelechem.2020.107598. Epub 2020 Jul 15. Bioelectrochemistry. 2020. PMID: 32711366 Free PMC article. Review.
-
Multiple nanosecond electric pulses increase the number but not the size of long-lived nanopores in the cell membrane.Biochim Biophys Acta. 2015 Apr;1848(4):958-66. doi: 10.1016/j.bbamem.2014.12.026. Epub 2015 Jan 10. Biochim Biophys Acta. 2015. PMID: 25585279 Free PMC article.
-
Calcium-mediated pore expansion and cell death following nanoelectroporation.Biochim Biophys Acta. 2014 Oct;1838(10):2547-54. doi: 10.1016/j.bbamem.2014.06.015. Epub 2014 Jun 28. Biochim Biophys Acta. 2014. PMID: 24978108 Free PMC article.
-
Expression of voltage-gated calcium channels augments cell susceptibility to membrane disruption by nanosecond pulsed electric field.Biochim Biophys Acta Biomembr. 2018 Nov;1860(11):2175-2183. doi: 10.1016/j.bbamem.2018.08.017. Epub 2018 Sep 1. Biochim Biophys Acta Biomembr. 2018. PMID: 30409513
-
In vitro electroporation detection methods - An overview.Bioelectrochemistry. 2018 Apr;120:166-182. doi: 10.1016/j.bioelechem.2017.12.005. Epub 2017 Dec 16. Bioelectrochemistry. 2018. PMID: 29289825 Review.
Cited by
-
Pulse Duration Dependent Asymmetry in Molecular Transmembrane Transport Due to Electroporation in H9c2 Rat Cardiac Myoblast Cells In Vitro.Molecules. 2021 Oct 30;26(21):6571. doi: 10.3390/molecules26216571. Molecules. 2021. PMID: 34770979 Free PMC article.
-
Pulsed Electric Field Ablation of Esophageal Malignancies and Mitigating Damage to Smooth Muscle: An In Vitro Study.Int J Mol Sci. 2023 Feb 2;24(3):2854. doi: 10.3390/ijms24032854. Int J Mol Sci. 2023. PMID: 36769172 Free PMC article.
-
Targeting Tumor Microenvironment by Metal Peroxide Nanoparticles in Cancer Therapy.Bioinorg Chem Appl. 2022 Dec 16;2022:5041399. doi: 10.1155/2022/5041399. eCollection 2022. Bioinorg Chem Appl. 2022. PMID: 36568636 Free PMC article. Review.
-
The interplay of excitation and electroporation in nanosecond pulse stimulation.Bioelectrochemistry. 2020 Dec;136:107598. doi: 10.1016/j.bioelechem.2020.107598. Epub 2020 Jul 15. Bioelectrochemistry. 2020. PMID: 32711366 Free PMC article. Review.
-
Quadrupoles for Remote Electrostimulation Incorporating Bipolar Cancellation.Bioelectricity. 2020 Dec 1;2(4):382-390. doi: 10.1089/bioe.2020.0024. Epub 2020 Dec 16. Bioelectricity. 2020. PMID: 34476367 Free PMC article.
References
-
- Zimmermann U., Neil G.A., editors. Electromanipulation of Cells. CRC Press; Boca Raton, FL, USA: 1996.
-
- Neumann E., Sowers A.E., Jordan C.A., editors. Electroporation and Electrofusion in Cell Biology. Plenum; New York, NY, USA: 1989.
-
- Pakhomov A.G., Miklavcic D., Markov M.S., editors. Advanced Electroporation Techniques in Biology in Medicine. CRC Press; Boca Raton, FL, USA: 2010. p. 528.
MeSH terms
Substances
Grants and funding
LinkOut - more resources
Full Text Sources
Miscellaneous
