

Gold Nanocylinders on Gold Film as a Multi-spectral SERS Substrate
- PMID: 32403295
- PMCID: PMC7279415
- DOI: 10.3390/nano10050927
Gold Nanocylinders on Gold Film as a Multi-spectral SERS Substrate
Abstract
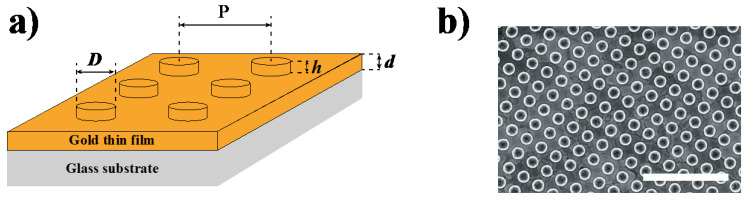
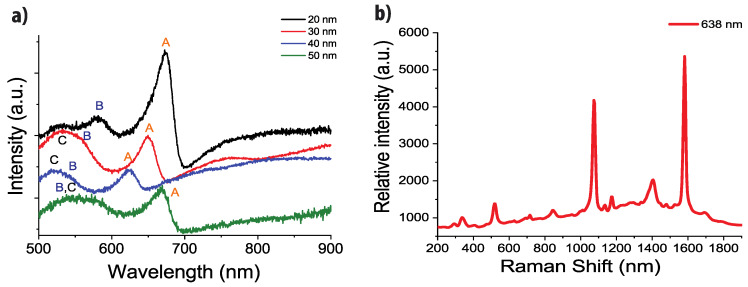
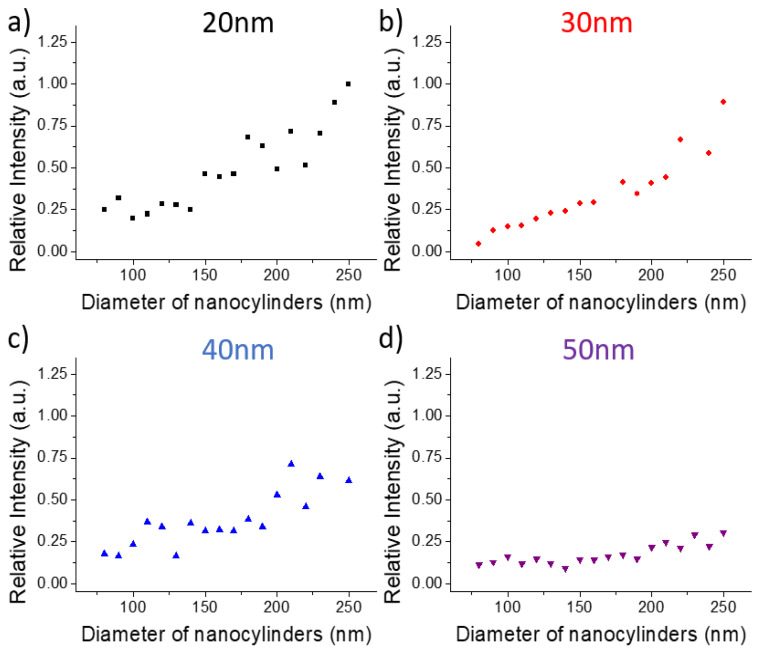
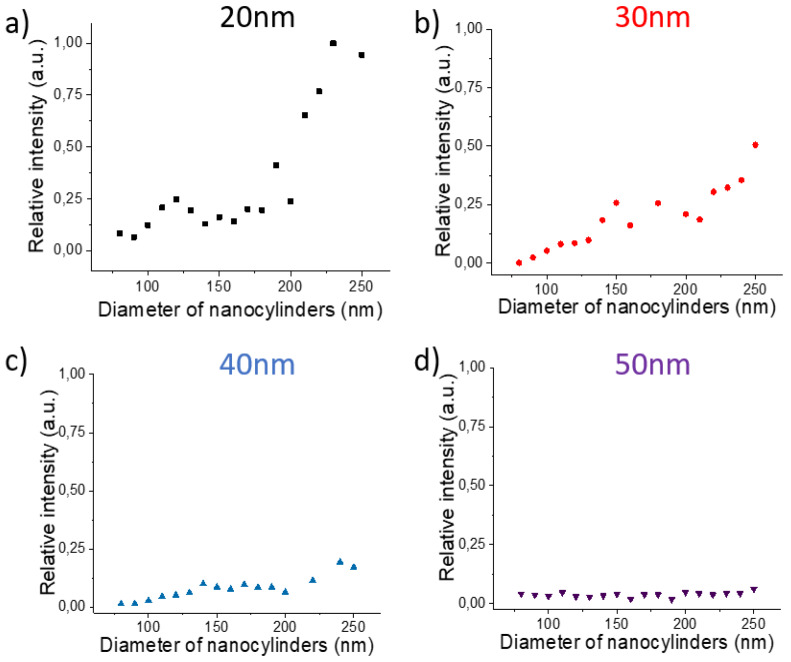
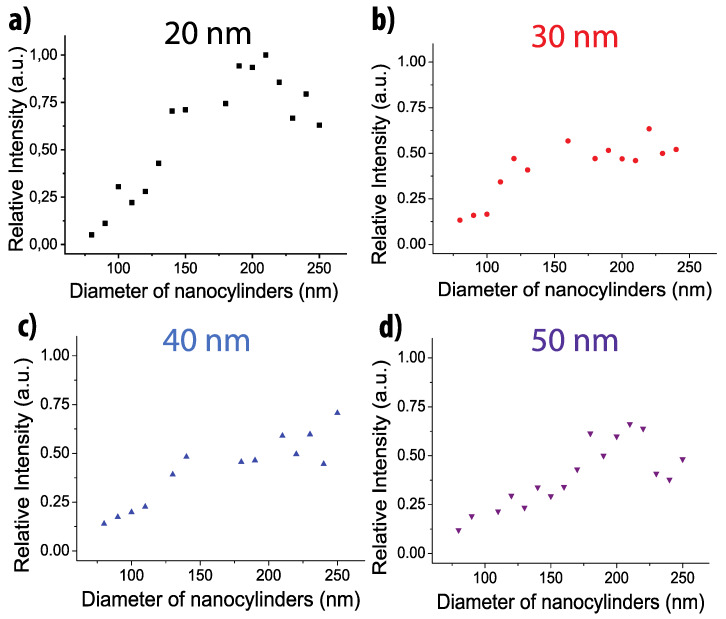
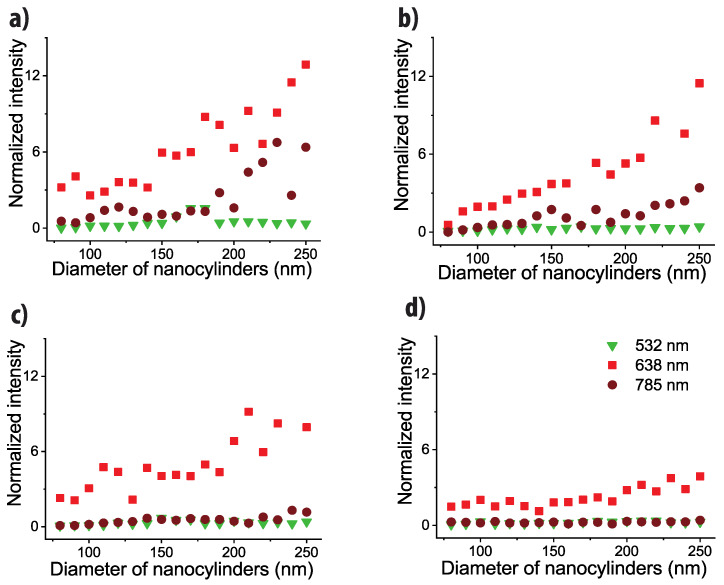
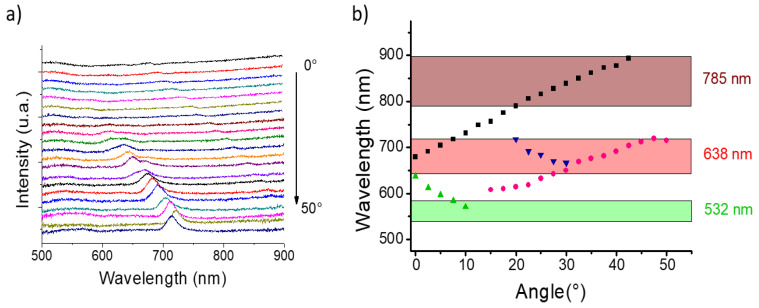
The surface enhanced Raman scattering (SERS) efficiency of gold nanocylinders deposited on gold thin film is studied. Exploiting the specific plasmonic properties of such substrates, we determine the influence of the nanocylinder diameter and the film thickness on the SERS signal at three different excitation wavelengths (532, 638 and 785 nm). We demonstrate that the highest signal is reached for the highest diameter of 250 nm due to coupling between the nanocylinders and for the lowest thickness (20 nm) as the excited plasmon is created at the interface between the gold and glass substrate. Moreover, even if we show that the highest SERS efficiency is obtained for an excitation wavelength of 638 nm, a large SERS signal can be obtained at all excitation wavelengths and on a wide spectral range. We demonstrate that it can be related with the nature of the plasmon (propagative plasmon excited through the nanocylinder grating) and with its angular dependence (tuning of the plasmon position with the excitation angle). Such an effect allows the excitation of plasmon on nearly the whole visible range, and paves the way to multispectral SERS substrates.
Keywords: SERS; multi-spectral substrate; optimization; plasmon.
Conflict of interest statement
The authors declare no conflict of interest.
Figures
Similar articles
-
SERS detection of biomolecules using lithographed nanoparticles towards a reproducible SERS biosensor.Nanotechnology. 2010 Nov 26;21(47):475501. doi: 10.1088/0957-4484/21/47/475501. Epub 2010 Oct 29. Nanotechnology. 2010. PMID: 21030778
-
Surface-enhanced Raman scattering on silvered porous alumina templates: role of multipolar surface plasmon resonant modes.Phys Chem Chem Phys. 2015 Dec 21;17(47):31780-9. doi: 10.1039/c5cp04197j. Phys Chem Chem Phys. 2015. PMID: 26563558
-
Labeled gold nanoparticles immobilized at smooth metallic substrates: systematic investigation of surface plasmon resonance and surface-enhanced Raman scattering.J Phys Chem B. 2006 Sep 7;110(35):17444-51. doi: 10.1021/jp0636930. J Phys Chem B. 2006. PMID: 16942083
-
Surface-Enhanced Raman Scattering and Fluorescence on Gold Nanogratings.Nanomaterials (Basel). 2020 Apr 17;10(4):776. doi: 10.3390/nano10040776. Nanomaterials (Basel). 2020. PMID: 32316451 Free PMC article.
-
Surface-enhanced Raman scattering: realization of localized surface plasmon resonance using unique substrates and methods.Anal Bioanal Chem. 2009 Aug;394(7):1747-60. doi: 10.1007/s00216-009-2762-4. Epub 2009 Apr 22. Anal Bioanal Chem. 2009. PMID: 19384546 Review.
Cited by
-
Biosensing Using SERS Active Gold Nanostructures.Nanomaterials (Basel). 2021 Oct 12;11(10):2679. doi: 10.3390/nano11102679. Nanomaterials (Basel). 2021. PMID: 34685120 Free PMC article. Review.
-
Latest Novelties on Plasmonic and Non-Plasmonic Nanomaterials for SERS Sensing.Nanomaterials (Basel). 2020 Jun 19;10(6):1200. doi: 10.3390/nano10061200. Nanomaterials (Basel). 2020. PMID: 32575470 Free PMC article. Review.
References
-
- Cottat M., Lidgi-Guigui N., Hamouda F., Bartenlian B., Venkataraman D., Marks R.S., Steel T., de la Chapelle M.L. Highly sensitive detection of paclitaxel by surface-enhanced Raman scattering. J. Opt. 2015;17:114019. doi: 10.1088/2040-8978/17/11/114019. - DOI
-
- Foti A., D’Andrea C., Villari V., Micali N., Donato M., Fazio B., Maragò O.M., Gillibert R., de la Chapelle M.L., Gucciardi P. Optical Aggregation of Gold Nanoparticles for SERS Detection of Proteins and Toxins in Liquid Environment: Towards Ultrasensitive and Selective Detection. Materials. 2018;11:440. doi: 10.3390/ma11030440. - DOI - PMC - PubMed
Grants and funding
LinkOut - more resources
Full Text Sources
Miscellaneous
