. 2020 Jul 31;127(4):466-482.
doi: 10.1161/CIRCRESAHA.119.316463. Epub 2020 May 14.

Role of the GLUT1 Glucose Transporter in Postnatal CNS Angiogenesis and Blood-Brain Barrier Integrity

Affiliations

Role of the GLUT1 Glucose Transporter in Postnatal CNS Angiogenesis and Blood-Brain Barrier Integrity

Koen Veys et al. Circ Res. .

Abstract

Rationale: Endothelial cells (ECs) are highly glycolytic and generate the majority of their energy via the breakdown of glucose to lactate. At the same time, a main role of ECs is to allow the transport of glucose to the surrounding tissues. GLUT1 (glucose transporter isoform 1/Slc2a1) is highly expressed in ECs of the central nervous system (CNS) and is often implicated in blood-brain barrier (BBB) dysfunction, but whether and how GLUT1 controls EC metabolism and function is poorly understood.

Objective: We evaluated the role of GLUT1 in endothelial metabolism and function during postnatal CNS development as well as at the adult BBB.

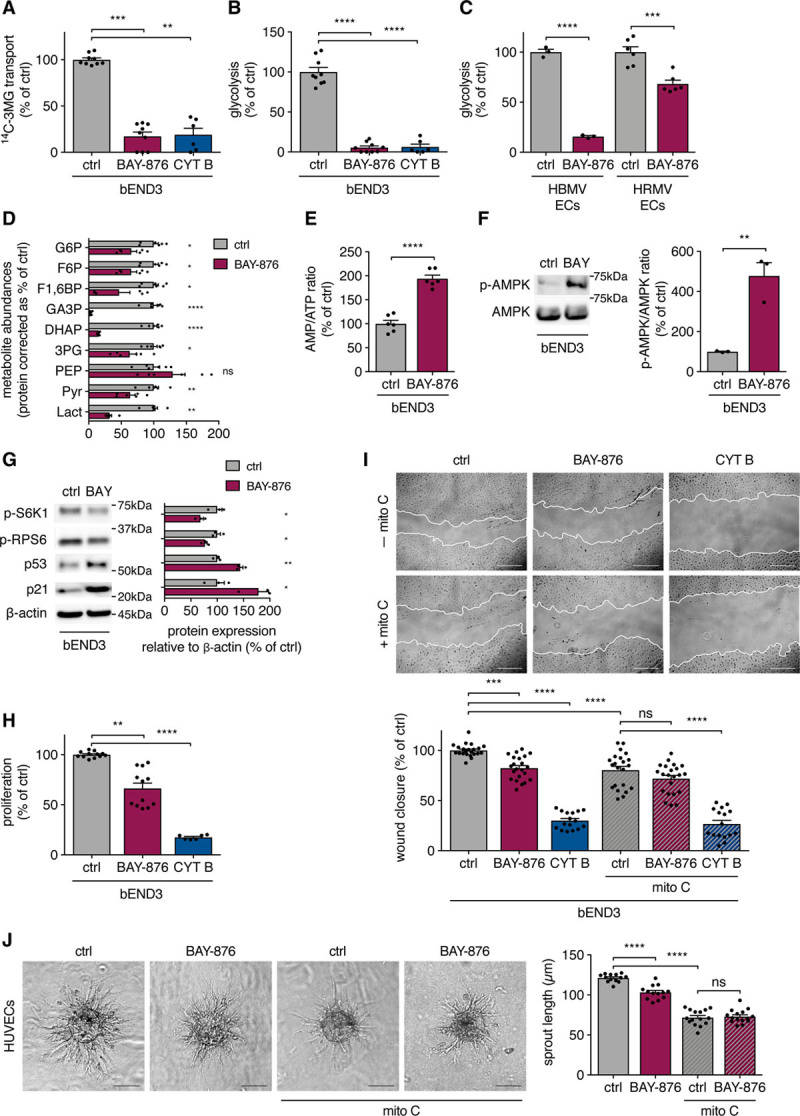
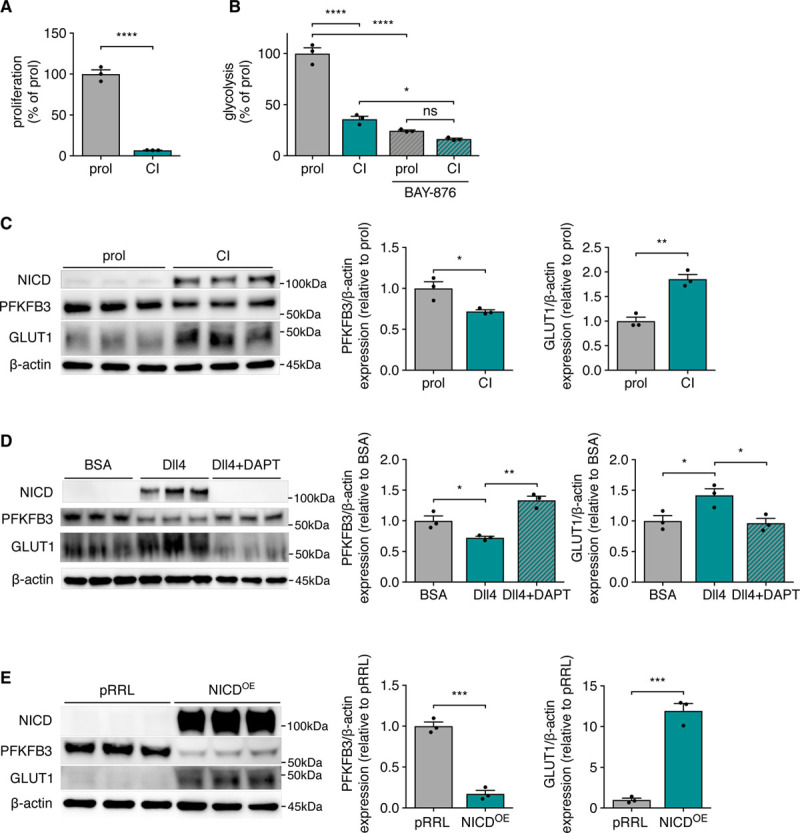
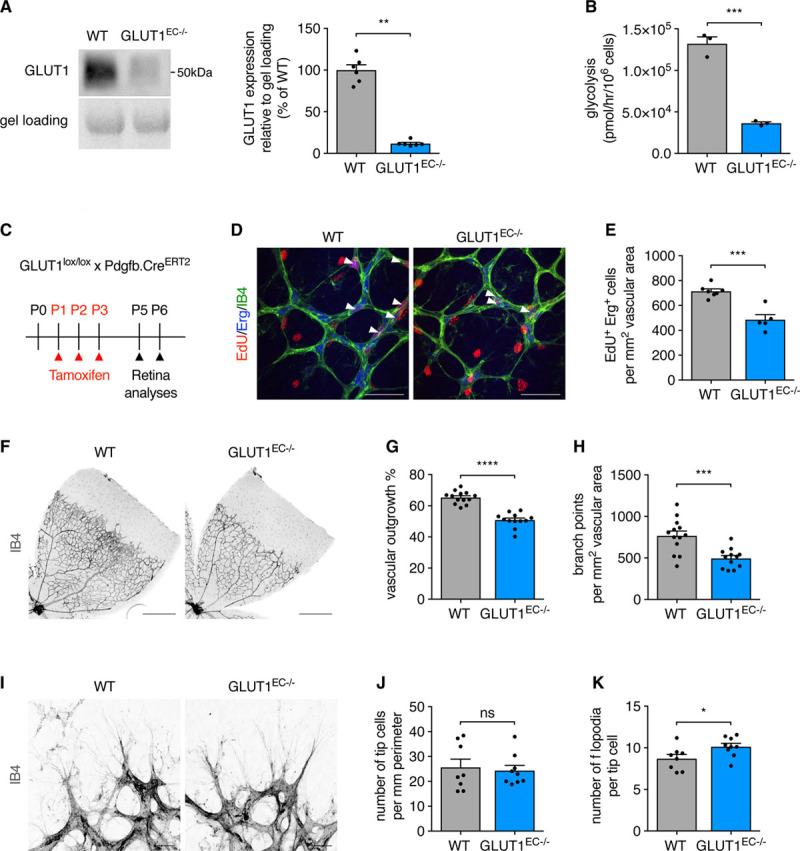
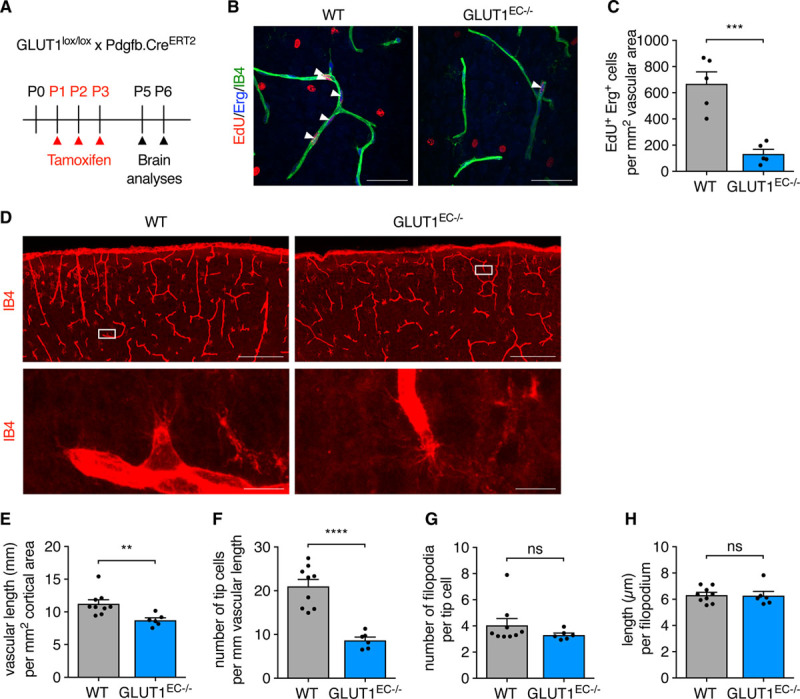
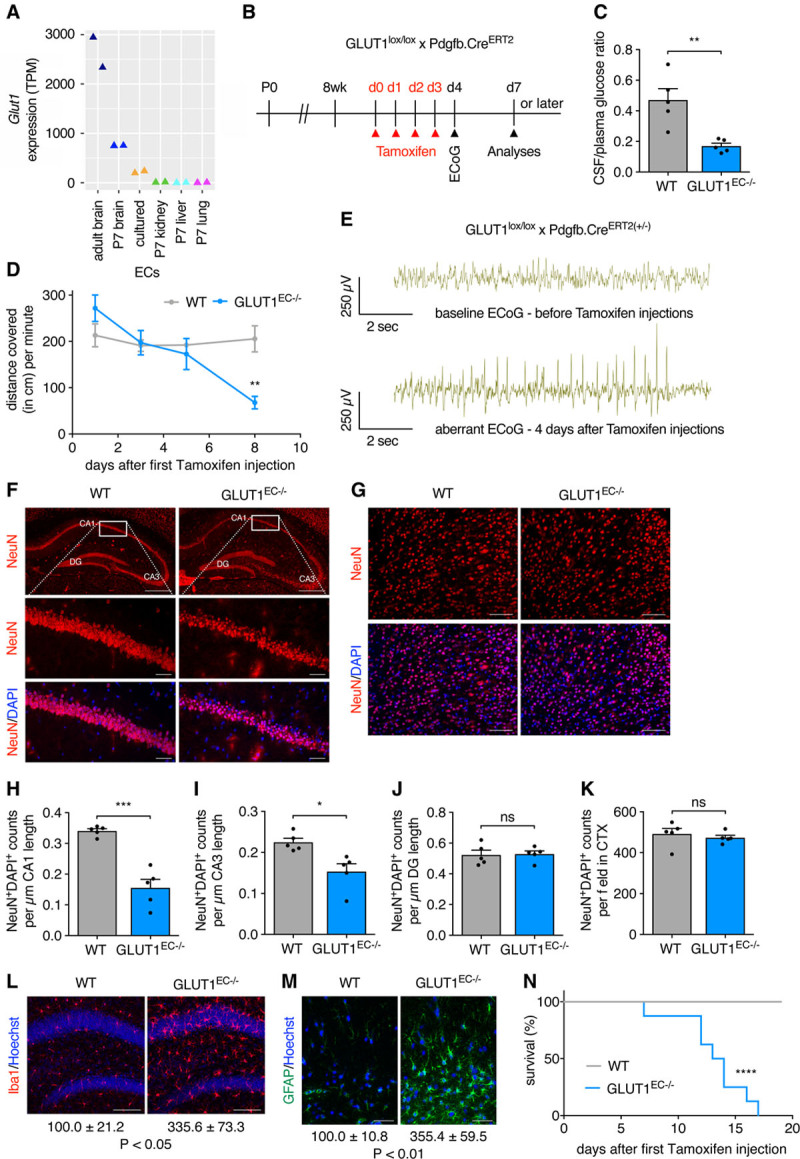
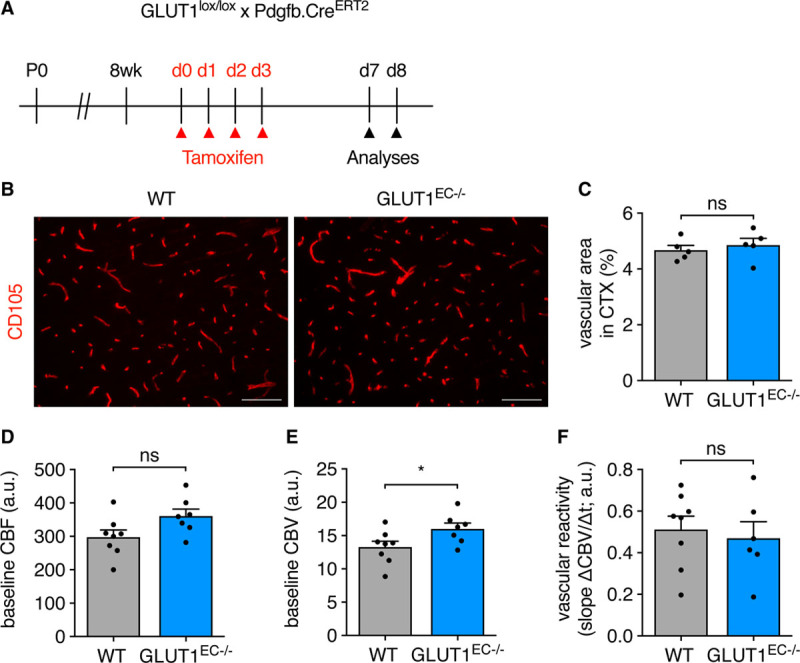
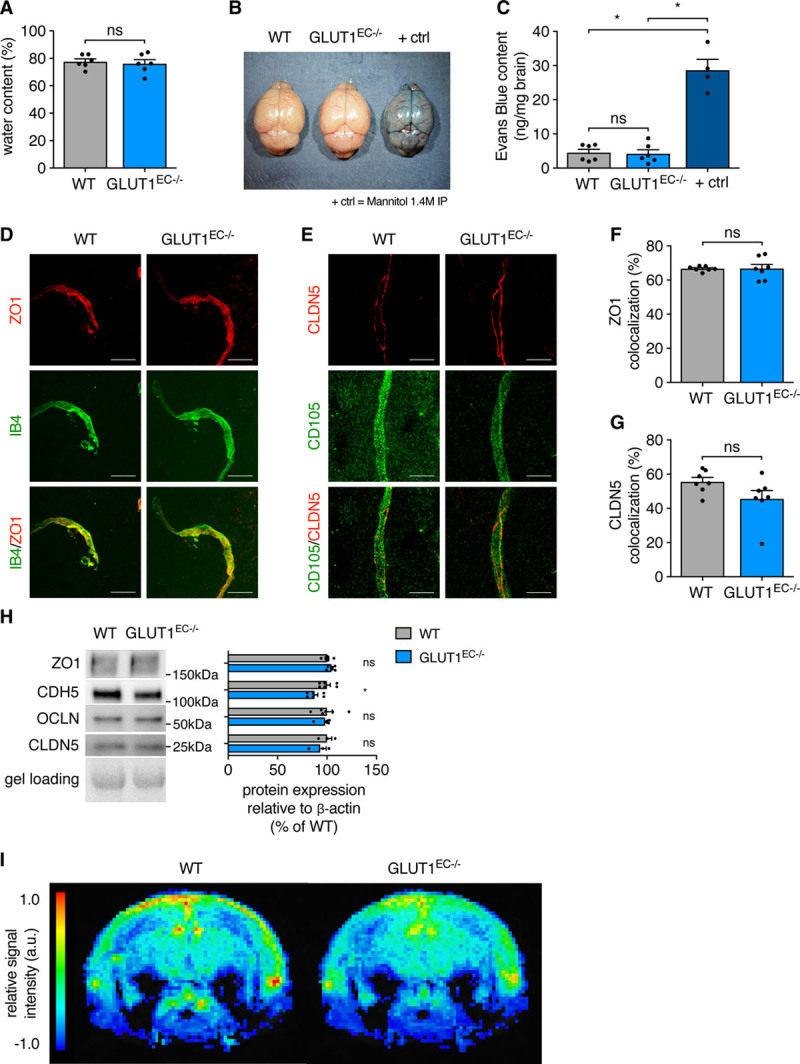
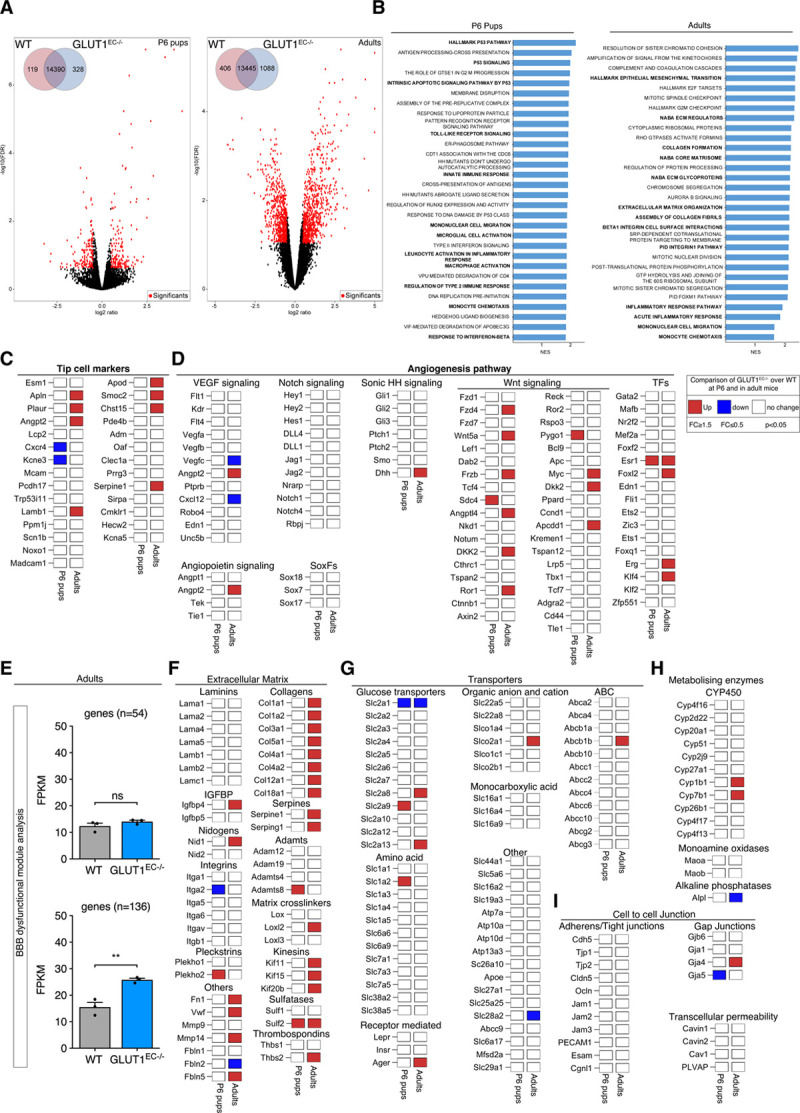
Methods and results: Inhibition of GLUT1 decreases EC glucose uptake and glycolysis, leading to energy depletion and the activation of the cellular energy sensor AMPK (AMP-activated protein kinase), and decreases EC proliferation without affecting migration. Deletion of GLUT1 from the developing postnatal retinal endothelium reduces retinal EC proliferation and lowers vascular outgrowth, without affecting the number of tip cells. In contrast, in the brain, we observed a lower number of tip cells in addition to reduced brain EC proliferation, indicating that within the CNS, organotypic differences in EC metabolism exist. Interestingly, when ECs become quiescent, endothelial glycolysis is repressed, and GLUT1 expression increases in a Notch-dependent fashion. GLUT1 deletion from quiescent adult ECs leads to severe seizures, accompanied by neuronal loss and CNS inflammation. Strikingly, this does not coincide with BBB leakiness, altered expression of genes crucial for BBB barrier functioning nor reduced vascular function. Instead, we found a selective activation of inflammatory and extracellular matrix related gene sets.

Conclusions: GLUT1 is the main glucose transporter in ECs and becomes uncoupled from glycolysis during quiescence in a Notch-dependent manner. It is crucial for developmental CNS angiogenesis and adult CNS homeostasis but does not affect BBB barrier function.

Keywords: blood-brain barrier; endothelium; extracellular matrix; glucose transport; glycolysis; homeostasis.


Figures

Figure 1.
Figure 1.
GLUT1 (glucose transporter isoform 1) inhibition impairs endothelial cell (EC) glucose metabolism and proliferation but not migration. A and B, 14C-3-O-methylglucose (3MG) transport (Kruskall-Wallis test and Dunn multiple comparisons test; A) and glycolytic flux (1-way ANOVA and Tukey multiple comparisons test; B) in cells from a brain-derived EC line (bEND3) incubated with 20 nmol/L BAY-876 (N4-[1-[(4-cyanophenyl)methyl]-5-methyl-3-(trifluoromethyl)-1H-pyrazol-4-yl]-7-fluoro-2,4-quinolinedicarboxamide) and 20 µmol/L cytochalasin B (CYT B) vs control. C, Glycolytic flux in human brain microvascular ECs (HBMV ECs) and human retinal microvascular ECs (HRMV ECs) incubated with 20 nmol/L BAY-876 vs control (Student t test). D, Abundances of glycolytic intermediates in bEND3 cells incubated with 20 nmol/L BAY-876 vs control (Student t test or Mann-Whitney U test). E, AMP/ATP ratio in cells from a brain-derived EC line (bEND3) incubated with 20 nmol/L BAY-876 vs control (Student t test). F and G, Western blot of p-AMPK (phospho-AMP-activated protein kinase), AMPK (F) and p-S6K1 (phospho-S6 kinase 1), p-RPS6 (phospho-ribosomal protein S6), p53, and p21 (G) in bEND3 cells incubated with 20 nmol/L BAY-876 vs control (Student t test). H, Proliferation rate of bEND3 cells incubated with 20 nmol/L BAY-876 and 20 µmol/L CYT B vs control (Kruskall-Wallis test and Dunn multiple comparisons test). I, Representative pictures and quantifications of scratch wound closure in bEND3 cells incubated with 20 nmol/L BAY-876 and 20 µmol/L CYT B vs control in conditions with and without mitomycin C (mito C) pretreatment (2-way ANOVA and Tukey multiple comparisons test). J, Representative pictures and quantifications of sprouting human umbilical vein EC (HUVEC) spheroids incubated with 40 nmol/L BAY-876 vs control in conditions with and without mitomycin C pretreatment (2-way ANOVA and Tukey multiple comparisons test). Scale bar=500 µm (I) and 100 µm (J). 3PG indicates 3-phosphoglycerate; AMP, adenosine monophosphate; ATP, adenosine triphosphate; DHAP, dihydroxyacetone phosphate; F1,6BP, fructose 1,6-bisphosphate; F6P, fructose 6-phosphate; G6P, glucose 6-phosphate; GA3P, glyceraldehyde 3-phosphate; Lact, lactate; PEP, phosphoenolpyruvate; and Pyr, pyruvate. *P<0.05, **P<0.01, ***P<0.001, and ****P<0.0001.
Figure 2.
Figure 2.
GLUT1 (glucose transporter isoform 1) expression is increased in quiescence and uncoupled from glycolysis. A, Proliferation rate of proliferating (prol) and contact inhibited (CI) human umbilical vein ECs (HUVECs; Student t test). B, Glycolytic flux in proliferating (prol) and contact inhibited (CI) HUVECs incubated with 20 nmol/L BAY-876 (N4-[1-[(4-cyanophenyl)methyl]-5-methyl-3-(trifluoromethyl)-1H-pyrazol-4-yl]-7-fluoro-2,4-quinolinedicarboxamide) vs control (2-way ANOVA and Tukey multiple comparisons test). C, Representative image and quantification of Western blot of Notch intracellular domain (NICD), PFKFB3 (6-phosphofructo-2-kinase/fructose-2,6-biphosphatase 3), and GLUT1 protein levels in proliferating vs contact inhibited HUVECs. β-actin is used as loading control (Student t test). D, Representative image and quantification of Western blot of NICD, PFKFB3, and GLUT1 protein levels in HUVECs cultured on BSA or Dll4 (delta-like 4) coated plates with or without γ-secretase inhibitor N-[N-(3,5-difluorophenacetyl)-L-alanyl]-S-phenylglycine t-butyl ester (DAPT; 20 μmol/L) treatment (1-way ANOVA and Tukey multiple comparisons test). E, Representative image and quantification of Western blot of NICD, PFKFB3, and GLUT1 protein levels in HUVECs with overexpression of NICD vs empty control overexpression vector (pRRL; Student t test). All values are normalized to the control condition (C–E). *P<0.05, **P<0.01, ***P<0.001, and ****P<0.0001.
Figure 3.
Figure 3.
Loss of EC-GLUT1 (endothelial glucose transporter isoform 1) impairs neonatal retinal angiogenesis. A, Representative Western blot and quantification for GLUT1 protein in primary isolated brain ECs from GLUT1EC−/− mice vs wild-type (WT) littermates (Mann-Whitney U test). B, Glycolytic flux in cultured primary isolated mouse ECs from GLUT1EC−/− mice vs WT littermates (Student t test). C, Schematic representation of experimental timing for retina analyses in GLUT1lox/lox×Pdgfb.CreERT2 pups. D and E, Representative pictures (D) and quantification (E) of 5-ethynyl-2’-deoxyuridine (EdU+)/ETS-related gene (Erg+) cells in the primary plexus of P5 GLUT1EC−/− pups vs WT littermates (Student t test). White arrows (D) indicate EdU+/Erg+ cells. F–H, Representative pictures from IB4 (isolectin griffonia simplicifolia B4)-stained flat-mounted retinas from P6 GLUT1EC−/− pups vs WT littermates (F) and quantifications of vascular outgrowth (G) and branch point density (H; Student t test). I–K, Representative pictures from IB4-stained retinal tip cells and filopodia from P6 GLUT1EC−/− pups vs WT littermates (I) and quantifications of tip cell number (J) and filopodia number per tip cell (K) (Student t test or Mann-Whitney U test). Scale bar=50 µm (D), 500 µm (F), and 20 µm (I). *P<0.05, **P<0.01, ***P<0.001, and ****P<0.0001.
Figure 4.
Figure 4.
Loss of EC-GLUT1 (endothelial glucose transporter isoform 1) impairs neonatal brain angiogenesis. A, Schematic representation of experimental timing for brain analyses in GLUT1lox/lox×Pdgfb.CreERT2 pups. B and C, Representative pictures (B) and quantification (C) of 5-ethynyl-2’-deoxyuridine (EdU+)/ETS-related gene (Erg+) cells in the primary plexus of P5 GLUT1EC−/− pups vs wild-type (WT) littermates (Student t test). White arrows (B) indicate EdU+/Erg+ cells. D and H, Representative pictures showing the cortical area and a tip cell magnification of IB4 (isolectin griffonia simplicifolia B4)-stained thick brain sections from P6 GLUT1EC−/− pups vs WT littermates (D) and corresponding quantifications of vascular length (E) tip cell number (F) filopodia number per tip cell (G) and filopodial length (H) (Student t test or Mann-Whitney U test). Scale bar=50 µm (B), 200 µm for upper and 10 µm for lower (D). **P<0.01, ***P<0.001, and ****P<0.0001.
Figure 5.
Figure 5.
Loss of EC-GLUT1 (endothelial glucose transporter isoform 1) leads to progressive neuronal loss, central nervous system (CNS) inflammation, and rapid lethality. A, Endothelial Glut1 expression levels (transcripts per million [TPM]) in adult mouse brain ECs, cultured brain ECs and ECs from brain, kidney, liver and lung from P7 pups as described in the Vascular Endothelial Cell Trans-omics Resource Database (VECTRDB). B, Schematic representation of experimental timing for brain vascular analyses in GLUT1lox/lox×Pdgfb.CreERT2 mice. C, Cerebrospinal fluid (CSF)/plasma glucose ratio in GLUT1EC−/− mice vs wild-type (WT) littermates (Student t test). D, Quantification of spontaneous movement in GLUT1EC−/− mice vs WT littermates at 1, 3, 5, and 8 days after the first tamoxifen injection (n=3 per group; repeated measures ANOVA with Sidak multiple comparisons test). E, Representative electrocorticography (ECoG) excerpts from Cre positive GLUT1lox/lox×Pdgfb.CreERT2 mice, monitored by telemetry-ECoG 24 h/day (n=3 per group) showing the baseline ECoG before the first tamoxifen injection and an aberrant ECoG 4 days after the first tamoxifen injection. F and G, Representative pictures of hippocampal (F) and of cortical (G) NeuN+ (neuronal nuclear protein)/DAPI+ neuronal nuclei in GLUT1EC−/− mice vs WT littermates >13 days after the first tamoxifen injection. H–K, Quantifications of the number of NeuN+/DAPI+ cells in the cornu ammonis 1 (CA1; H), CA3 (I), dentate gyrus (DG; J), and cortical region (K) in GLUT1EC−/− mice vs WT littermates (Student t test). L and M, Representative pictures of Iba1+ microglia (L) and GFAP+ (glial fibrillary acidic protein) astrocytes (M) in the hippocampus of GLUT1EC−/− mice vs WT littermates (n=4 per group). Quantifications show % Iba1+ and % GFAP+ area vs WT (n=4 per group; Student t test). N, Kaplan-Meier survival curve of GLUT1EC−/− mice vs WT littermates (n=8 per group; Log-rank (Mantel-Cox) test). Scale bar=500 µm for upper, 50 µm for lower (F), 50 µm (G), 100 µm (L), and 50 µm (M). *P<0.05, **P<0.01, ***P<0.001, and ****P<0.0001.
Figure 6.
Figure 6.
Loss of EC-GLUT1 (endothelial glucose transporter isoform 1) does not impair brain vascular function. A, Schematic representation of experimental timing for brain vascular analyses in adult GLUT1lox/lox×Pdgfb.CreERT2 mice. B and C, Representative pictures of the cluster of differentiation 105-stained cortical vasculature in adult GLUT1EC−/− mice vs wild-type (WT) littermates (B) and quantifications of vascular area (C; Student t test). D–F, Functional magnetic resonance imaging (fMRI) measurements in GLUT1EC−/− mice vs WT littermates for assessment of baseline cerebral blood flow (CBF; D), baseline cerebral blood volume (CBV; E), and for the determination of vascular reactivity, that is, dynamic CBV in response to the injection of the pharmacological vasodilator acetazolamide (F) (Student t test). Scale bar=100 µm (B). *P<0.05.
Figure 7.
Figure 7.
Loss of EC-GLUT1 (endothelial glucose transporter isoform 1) does not impair blood-brain barrier (BBB) physical barrier properties. A, Brain water content in GLUT1EC−/− mice vs wild-type (WT) littermates (Student t test). B and C, Representative pictures from brains of Evans Blue injected GLUT1EC−/− mice vs WT littermates and 1.4 mol/L mannitol-injected WT littermates as BBB-breaching positive controls (B) and quantifications of Evans Blue content from formamide extracted brains (C; Kruskall-Wallis test and Dunn multiple comparisons test). D–G, Representative pictures of IB4 (isolectin griffonia simplicifolia B4)- or cluster of differentiation 105-stained cerebral blood vessels in GLUT1EC−/− mice vs WT littermates, co-stained with the tight junction marker ZO1 (zonula occludens 1; D) or CLDN5 (claudin-5; E) and quantification of vascular (IB4 positive) colocalization analyses with ZO1 (F) and CLDN5 (G) (Student t test). H, Representative Western blots for ZO1, CDH5 (vascular endothelial cadherin), OCLN (occludin), and CLDN5 protein in primary isolated brain ECs from GLUT1EC−/− mice vs WT littermates corrected for gel loading relative to WT (Student t test or Mann-Whitney U test). I, Color coded mean leakage map in GLUT1EC−/− mice (n=7) vs WT littermates (n=8) showing relative signal intensity, calculated from dynamic contrast-enhanced magnetic resonance imaging measurements to evaluate blood-brain barrier permeability. Scale bar=20 µm (D–E). *P<0.05.
Figure 8.
Figure 8.
Transcriptional alterations upon loss of GLUT1 (glucose transporter isoform 1) in brain endothelial cells (ECs). A, Volcano plots displaying the magnitude of the differential expression between wild-type (WT) and GLUT1EC−/− brain ECs either at P6 (left; n=4 per genotype) or in adulthood (right; n=3 per genotype). Each dot represents 1 gene that has detectable expression both in WT and GLUT1EC−/− brain ECs. Black dots represent genes that are not altered. Differentially expressed genes are labeled in red. The number of differentially expressed genes between WT and GLUT1EC−/− brain ECs is shown (inset). FDR-values were calculated using Benjamini-Hochberg method; P≤0.01, log ratio ≥0.5). B, Gene set enrichment analysis for both P6 pups (left) or adults (right) showing significantly enriched pathway ranked by normalized enrichment score (NES) and P value. Key pathways highlighted in bold include inflammatory pathways (P6 pups and adults), and p53 and extracellular matrix signaling in P6 pups and adults respectively. C and D, Differential expression for a selected set of tip cell marker genes (C) and angiogenesis related genes (D) at P6 (left column) or in adults (right column) based on criteria defined in the legend box. E, Blood-brain barrier (BBB) dysfunctional modules analysis showing the comparison of the average FPKM values of the core (n=54), as well the compiled core and adjunct (n=136) genes in WT vs GLUT1EC−/− in adulthood (Student t test). F, Differential expression patterns of extracellular matrix related genes including laminins, collagens, serpines, adamts, integrins, matrix cross linkers, and others based on criteria defined in the legend box. G, Differential expression patterns of different glucose, amino acids, monocarboxylic acid, ABC, organic anion, and cation transporters based on criteria defined in the legend box. H, Differential expression of metabolizing enzymes (CYP450, MAOs, and ALPs) implicated in BBB function based on criteria defined in the legend box. I, Differential expression patterns of adherens/tight junctions, gap junctions, and transcellular permeability genes implicated in BBB function based on criteria defined in the legend box (n=3 per genotype for adults; n=4 per genotype for P6 pups). **P<0.01.

References

    1. Adams RH, Alitalo K. Molecular regulation of angiogenesis and lymphangiogenesis. Nat Rev Mol Cell Biol 20078464–478doi: 10.1038/nrm2183 - PubMed
    1. Potente M, Gerhardt H, Carmeliet P. Basic and therapeutic aspects of angiogenesis. Cell 2011146873–887doi: 10.1016/j.cell.2011.08.039 - PubMed
    1. Kummitha CM, Kalhan SC, Saidel GM, Lai N. Relating tissue/organ energy expenditure to metabolic fluxes in mouse and human: experimental data integrated with mathematical modeling. Physiol Rep. 2014;2:e12159. doi: 10.14814/phy2.12159. - PMC - PubMed
    1. Aird WC. Phenotypic heterogeneity of the endothelium: I. Structure, function, and mechanisms. Circ Res 2007100158–173doi: 10.1161/01.RES.0000255691.76142.4a - PubMed
    1. De Bock K, Georgiadou M, Schoors S, Kuchnio A, Wong BW, Cantelmo AR, Quaegebeur A, Ghesquière B, Cauwenberghs S, Eelen G, et al. Role of PFKFB3-driven glycolysis in vessel sprouting. Cell 2013154651–663doi: 10.1016/j.cell.2013.06.037 - PubMed

Publication types

MeSH terms