

Eco-epidemiological assessment of the COVID-19 epidemic in China, January-February 2020
- PMID: 32404043
- PMCID: PMC7269037
- DOI: 10.1080/16549716.2020.1760490
Eco-epidemiological assessment of the COVID-19 epidemic in China, January-February 2020
Abstract
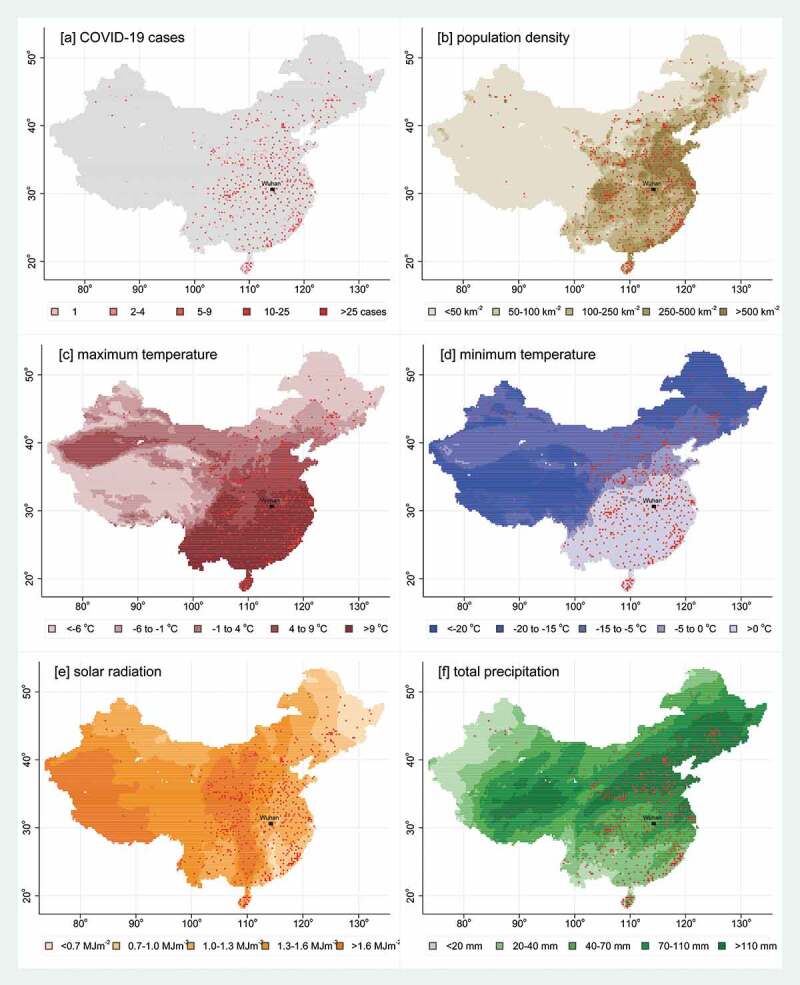
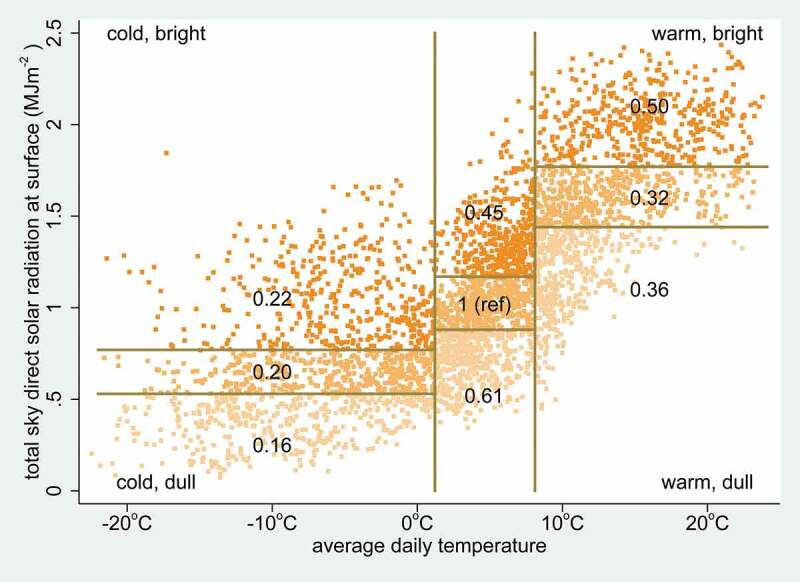
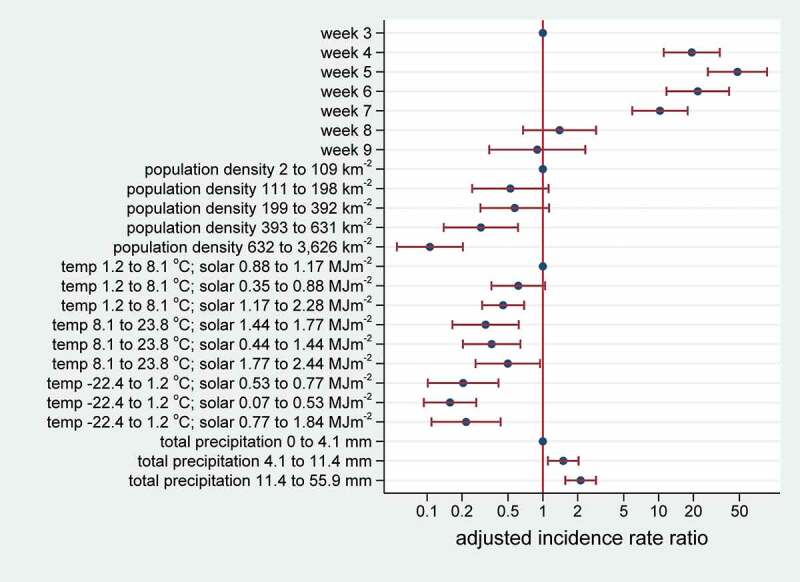
Background: The outbreak of COVID-19 in China in early 2020 provides a rich data source for exploring the ecological determinants of this new infection, which may be of relevance as the pandemic develops.Objectives: Assessing the spread of the COVID-19 across China, in relation to associations between cases and ecological factors including population density, temperature, solar radiation and precipitation.Methods: Open-access COVID-19 case data include 18,069 geo-located cases in China during January and February 2020, which were mapped onto a 0.25° latitude/longitude grid together with population and weather data (temperature, solar radiation and precipitation). Of 15,539 grid cells, 559 (3.6%) contained at least one case, and these were used to construct a Poisson regression model of cell-weeks. Weather parameters were taken for the preceding week given the established 5-7 day incubation period for COVID-19. The dependent variable in the Poisson model was incident cases per cell-week and exposure was cell population, allowing for clustering of cells over weeks, to give incidence rate ratios.Results: The overall COVID-19 incidence rate in cells with confirmed cases was 0.12 per 1,000. There was a single confirmed case in 113/559 (20.2%) of cells, while two grid cells recorded over 1,000 confirmed cases. Weekly means of maximum daily temperature varied from -28.0°C to 30.1°C, minimum daily temperature from -42.4°C to 23.0°C, maximum solar radiation from 0.04 to 2.74 MJm-2 and total precipitation from 0 to 72.6 mm. Adjusted incidence rate ratios suggested brighter, warmer and drier conditions were associated with lower incidence.Conclusion: Though not demonstrating cause and effect, there were appreciable associations between weather and COVID-19 incidence during the epidemic in China. This does not mean the pandemic will go away with summer weather but demonstrates the importance of using weather conditions in understanding and forecasting the spread of COVID-19.
Keywords: COVID19; China; SARS-CoV-2; corona virus; weather.
Conflict of interest statement
No potential conflict of interest was reported by the author.
Figures
References
MeSH terms
LinkOut - more resources
Full Text Sources
Miscellaneous