. 2020 May 13;10(1):7907.
doi: 10.1038/s41598-020-64431-4.

Synovial tissue transcriptomes of long-standing rheumatoid arthritis are dominated by activated macrophages that reflect microbial stimulation

Affiliations

Synovial tissue transcriptomes of long-standing rheumatoid arthritis are dominated by activated macrophages that reflect microbial stimulation

Biljana Smiljanovic et al. Sci Rep. .

Abstract

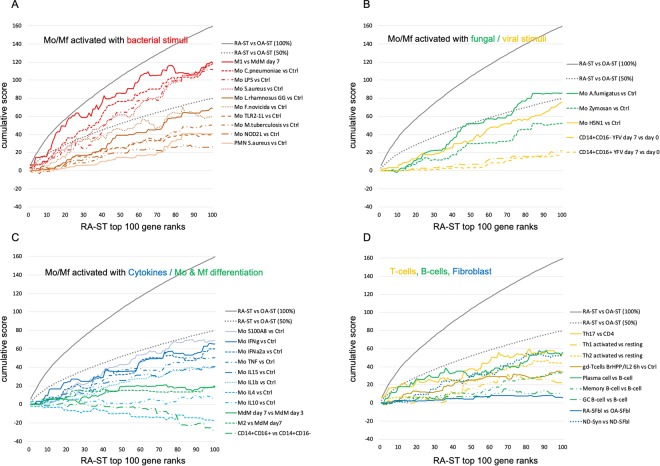
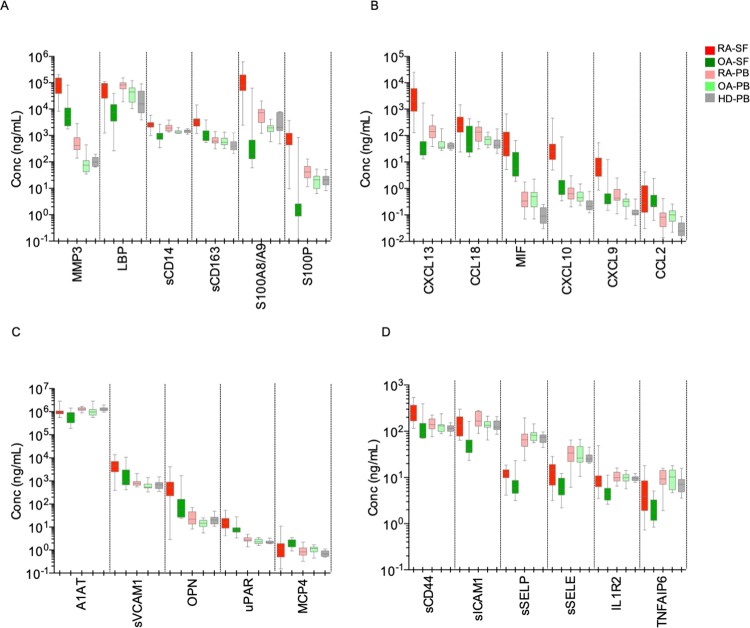
Advances in microbiome research suggest involvement in chronic inflammatory diseases such as rheumatoid arthritis (RA). Searching for initial trigger(s) in RA, we compared transcriptome profiles of highly inflamed RA synovial tissue (RA-ST) and osteoarthritis (OA)-ST with 182 selected reference transcriptomes of defined cell types and their activation by exogenous (microbial) and endogenous inflammatory stimuli. Screening for dominant changes in RA-ST demonstrated activation of monocytes/macrophages with gene-patterns induced by bacterial and fungal triggers. Gene-patterns of activated B- or T-cells in RA-ST reflected a response to activated monocytes/macrophages rather than inducing their activation. In contrast, OA-ST was dominated by gene-patterns of non-activated macrophages and fibroblasts. The difference between RA and OA was more prominent in transcripts of secreted proteins and was confirmed by protein quantification in synovial fluid (SF) and serum. In total, 24 proteins of activated cells were confirmed in RA-SF compared to OA-SF and some like CXCL13, CCL18, S100A8/A9, sCD14, LBP reflected this increase even in RA serum. Consequently, pathogen-like response patterns in RA suggest that direct microbial influences exist. This challenges the current concept of autoimmunity and immunosuppressive treatment and advocates new diagnostic and therapeutic strategies that consider microbial persistence as important trigger(s) in the etiopathogenesis of RA.


Conflict of interest statement

The authors declare no competing interests.

Figures

Figure 1
Figure 1
Overview of the study. (1) Synovial tissue (ST) biopsies from rheumatoid arthritis (RA) and osteoarthritis (OA) patients were profiled for gene expression with Affymetrix HG-U133A arrays. Pair-wise comparisons between 10 RA-ST and 10 OA-ST were performed by applying the BioRetis workflow, and the obtained transcriptome profiles were analyzed for differentially expressed genes with gene-set enrichment analysis (GSEA), Ingenuity pathway analysis (IPA), DAVID and reference transcriptomes. (2) Search for the gene-patterns of cells that infiltrate synovial tissues in RA-ST and OA-ST was performed with 38 reference transcriptomes of 12 cell types including: synovial fibroblasts (SFbl), endothelial cells (EC), platelets (Plt), B-, T-, NK-cells, monocytes, macrophages, DC and granulocytes. (3) This initial cell type screening with 38 transcriptomes was extended to stimulation and differentiation patterns with 182 reference transcriptomes that portrayed 64 different cell conditions including differentiation and activation of lymphoid cells as well as activation of myeloid cells with bacterial, fungal, viral pathogens and various inflammatory mediators (TNF, IL15, IL1β, IL4, IL10, IFNα, IFNγ). (4) Quantitative assessment of cell type specific and stimulus specific activation in RA-ST. (5) Validation of transcriptome data by selecting secreted molecules from RA-ST profile and determining these proteins in synovial fluid and serum from RA and OA patients.
Figure 2
Figure 2
Transcriptome profiles distinguish RA- from OA-synovial tissues (ST) and reveal involvement of innate and adaptive immunity in RA pathogenesis. (A) Hierarchical clustering (Euclidean distance, average linkage) with 2019 differentially expressed probe-sets (rows), which were identified by pair-wise comparisons between RA (n = 10) and OA (n = 10) synovial tissue transcriptomes, separate RA from OA samples (columns). Signals were log-transformed and z-normalized for each probe set to display relative intensities as indicated by the scale bar. Principal component analysis (PCA) was performed for the 20 samples based on the differentially expressed genes (B). Based on this PCA, a synchronized representation of the 2019 probe-sets is displayed in (C). The first 3 principal components, PC1, PC2, and PC3, reflect 42%, 9% and 7% of variance, respectively. Samples from RA patients were coloured in red, those from OA in green (A and B). Probe-sets highest in RA-ST (n = 1010) are red and those highest in OA-ST (n = 1009) are blue (A and C). Gene set enrichment analysis (GSEA) of the 2019 differentially expressed probe-sets identified particular KEGG pathways for RA-ST and OA-ST, which suggest different pathomechanisms in these two diseases. The KEGG pathways presented here with enrichment plots and heatmaps of gene-sets accentuated the role of innate immunity, cytokines, B-, T- and NK-cells in RA pathogenesis (DH) and tissue damage without substantial activation of the immune system in OA (IM).
Figure 3
Figure 3
Searching for cell type specific gene-patterns identified a dominance of monocyte/macrophage infiltration in RA-ST and of synovial fibroblasts in OA-ST. In total, 38 reference transcriptomes (C and F) were applied for analysis of up-regulated probe-sets in RA-ST (n = 1010) (A) and OA-ST (n = 1009) (D). These included: synovial fibroblasts (SFbl) (n = 4, 2 from RA and 2 from OA patients; dark blue), endothelial cells (EC) (n = 4; light blue), platelets (Plt) (n = 3; cyan), CD19+B cells (n = 3; green), CD4+T cells (n = 3; yellow), CD8+T cells (n = 3; yellow), CD56+NK cells (n = 3; yellow), CD1+DC (n = 3; red), CD14+ monocytes (n = 3; red), macrophages (n = 3; differentiated for 3 days from blood monocytes of healthy donors; dark red), macrophages isolated from synovial fluid of RA patients (n = 3; dark red) and CD15+ granulocytes (n = 3; pink). The overview of reference transcriptomes is provided in supplementary table 4. Co-expression matrices (B) and (E) were generated by correlating expression of the 1010 and 1009 probe-sets in the reference transcriptomes C and F, respectively. These matrices of correlation coefficients were hierarchically clustered to group co-expressed genes for pattern search in the reference transcriptomes. This order of genes was applied to sort probe-sets in RA-ST and OA-ST (A and D) and in reference transcriptomes (C and F). This alignment identified the patterns, which were characteristic for different cell types.
Figure 4
Figure 4
Co-expression analyses with reference transcriptomes of activated cell types identified monocyte/macrophage responses in RA-ST that overlapped with those triggered by microbes. Up-regulated probe-sets (n = 1010) in RA-ST (n = 10) (A) and up-regulated probe-sets (n = 1009) in OA-ST (n = 10) (D) were analysed with 203 reference transcriptomes (182 different reference transcriptomes with repeated control samples for different stimuli of the same experiment; listed in supplementary tables 4 and 5). In brief, the previous 38 reference transcriptomes used to define the main populations of immune cells (Fig. 3), were extended by additional populations of B-cells, T-cells, and monocytes (Mo), Mf, monocyte derived Mf (MDM) and monocyte derived DC (MDDC), which were activated with different stimuli. These were applied to calculate and cluster the co-expression matrices (B and E) and to align patterns with expression in RA-ST and OA-ST (A and D) and with the reference transcriptomes (C and F). Colour codes: Synovial fibroblasts (SFbl) (n = 4, dark blue), Endothelial cells (EC) (n = 4, light blue), Platelets (Plt) (n = 3, cyan); B cell types (green): CD19+(n = 3), naïve- (n = 3), memory- (n = 3), germinal centre-B cells (n = 3) and plasma cells (n = 3); T cell types (yellow): CD4+ (n = 3), CD8+ (n = 3), naïve- (n = 3), regulatory- (n = 3), resting (n = 9) and activated: γδ- (n = 3), Th1- (n = 3), Th2- (n = 3), and Th17-cells (n = 3). Activation of γδT was performed with the phosphoantigen BrHPP and IL2, while Th1 and Th2 cells were activated with PMA/Ionomycin; CD56+NK cells (n = 3, yellow); Myeloid cells (red): Mo, Mf, MDM, MDDC, CD1+DC and CD15+ granulocytes and their activation by broad spectrum of stimuli including: (1) Bacterial stimuli: (1) Mycobacterium tuberculosis, (2) Staphylococcus aureus, (3) Lactobacillus rhamnosus LGG, (4) NOD2L stimulation (muramyl dipeptide), (5) TLR2/1 L stimulation (triacylated lipopeptide), (6) Francisella novicida, and (7) Chlamydia pneumoniae. (2) Fungal stimuli: (1) zymosan A and (2) Aspergillus fumigatus. (3) Viral stimuli: (1) live attenuated viral strain of yellow fever vaccine and (2) H5N1 influenza. (4) Cytokines: TNF, LPS, IFNγ, IFNα2a, IL4, IL10, IL15 and IL1β. (5) Alarmin: S100A8. (6) In vitro polarisation: of monocytes to M1-Mf or M2-Mf were performed with LPS + IFNγ and IL4, respectively.
Figure 5
Figure 5
Quantitative assessments of cell-type and stimulus specific activation of the top 100 genes in RA-ST. Out of the 1010 probe-sets up-regulated in RA-ST vs OA-ST, the top 100 genes with the highest score values (determined by SLR and frequency of changes for each gene) were selected and ranked by scores. These ranks are represented on the abscissa. The ordinate shows the cumulative sum of scores as it changes with each additional rank and its gene. As target value, the grey line indicates the cumulative sum of scores of RA-ST (100% score) and as auxiliary value, the dotted grey line indicates its 50% value. For the genes on the abscissa, we applied the scores obtained from different comparisons between reference transcriptomes as indicated in the legend to the right. (A) presents the cumulative sum of scores for bacterial activation of monocytes/macrophages with LPS and IFNγ (M1-Mf), C. pneumoniae, LPS, S. aureus, L. rhamnosus, F. novicida, TLR1/2 L, M. tuberculosis, NOD2L and granulocytes with S. aureus. (B) indicates the scoring achieved by fungal and viral activation in monocytes/macrophages induced by A. fumigatus, zymosan A, H5N1 influenza virus and yellow fever vaccination in classical (CD14++CD16) and non-classical (CD14+CD16+) monocytes. (C) shows the scoring from reference comparisons (supplementary table 6) that present cytokine induced activation and differentiation in monocytes/macrophages. It included profiles of TNF, IFNγ, IFNα2a, IL4, IL10, IL15, IL1β and S100A8 stimulation, of macrophage differentiation with CSF2 for 7 days and of non-classical (CD14++CD16) compared to classical (CD14++CD16) blood monocytes. (D) outlines the scoring for activated T-cells, B-cells and synovial fibroblasts (SFbl). Activation of T-cells was determined in comparisons between Th1 activated vs Th1 resting, Th2 activated vs Th2 resting, and Th17 activated vs CD4 T-cells. B-cell profiles were determined in comparisons between plasma-, memory B- and germinal center (GC-) B-cells to naïve B-cells. Profiles of synovial fibroblast were determined in comparisons of in vitro cultured RA-SFbl and OA-SFbl and of native synovial tissue compared with in vitro cultured SFbl, both from normal joints of tissue donors (collected early post mortem).
Figure 6
Figure 6
Quantitative assessment of bacteria induced activation in the top 100 genes encoding secreted/shedded molecules in RA-ST. In total, 345 out of the 1010 probe-sets up-regulated in RA-ST encoded secreted/shedded molecules. Out of these 345 probe-sets, the top 100 genes with the highest score values were selected and ranked by scores. These ranks with gene names are represented on the abscissa. The ordinate shows the cumulative sum of scores as it changes with each newly added gene. As target value, the grey line indicates the cumulative sum of scores for secreted/shedded molecules of RA-ST (100% score) and as auxiliary value, the dotted grey line indicates its 50% value. We applied the scores obtained from different comparisons between stimulated reference transcriptomes and unstimulated controls as indicated in the legend to the right: monocytes/macrophages stimulated with LPS and IFNγ (M1-Mf), C. pneumoniae, LPS, S. aureus, L. rhamnosus, F. novicida, TLR1/2L, M. tuberculosis, NOD2L and granulocytes with S. aureus. Red arrows indicate selected transcripts of secreted molecules, which were validated at the protein level.
Figure 7
Figure 7
Validation of 23 secreted proteins in RA-SF and corresponding sera indicate their predominant production in the joint. (A and B) Inflammatory response molecules that differentiated RA-SF from OA-SF (exception: CCL2), and RA-serum from HD-serum. These proteins were elevated in RA-SF when compared to RA-serum (exception: LBP) and obviously diluted and/or neutralised in sera. (C and D) Inflammatory molecules that differentiated RA-SF from OA-SF and showed moderate or no dilution in sera. Protein concentrations were measured in paired samples of synovial fluid (SF) and serum from RA (n = 18) and OA (n = 15) patients as well as in serum from healthy donors (HD; n = 14). RA-SF: red; OA-SF: green; RA-serum: light red; OA-serum: light green, HD (healthy donors: grey).

References

    1. Rantapaa-Dahlqvist S, et al. Antibodies against cyclic citrullinated peptide and IgA rheumatoid factor predict the development of rheumatoid arthritis. Arthritis rheumatism. 2003;48:2741–2749. doi: 10.1002/art.11223. - DOI - PubMed
    1. Majka DS, et al. Duration of preclinical rheumatoid arthritis-related autoantibody positivity increases in subjects with older age at time of disease diagnosis. Ann. Rheum. Dis. 2008;67:801–807. doi: 10.1136/ard.2007.076679. - DOI - PMC - PubMed
    1. Weyand CM, Goronzy JJ. Pathomechanisms in rheumatoid arthritis–time for a string theory? J. Clin. Invest. 2006;116:869–871. doi: 10.1172/JCI28300. - DOI - PMC - PubMed
    1. Smolen JS, et al. Treating rheumatoid arthritis to target: recommendations of an international task force. Ann. Rheum. Dis. 2010;69:631–637. doi: 10.1136/ard.2009.123919. - DOI - PMC - PubMed
    1. Smolen JS, et al. EULAR recommendations for the management of rheumatoid arthritis with synthetic and biological disease-modifying antirheumatic drugs: 2013 update. Ann. Rheum. Dis. 2014;73:492–509. doi: 10.1136/annrheumdis-2013-204573. - DOI - PMC - PubMed

Publication types

MeSH terms