. 2020 May 13;11(1):2389.
doi: 10.1038/s41467-020-16113-y.

Characterization of the development of the mouse cochlear epithelium at the single cell level

Affiliations

Characterization of the development of the mouse cochlear epithelium at the single cell level

Likhitha Kolla et al. Nat Commun. .

Abstract

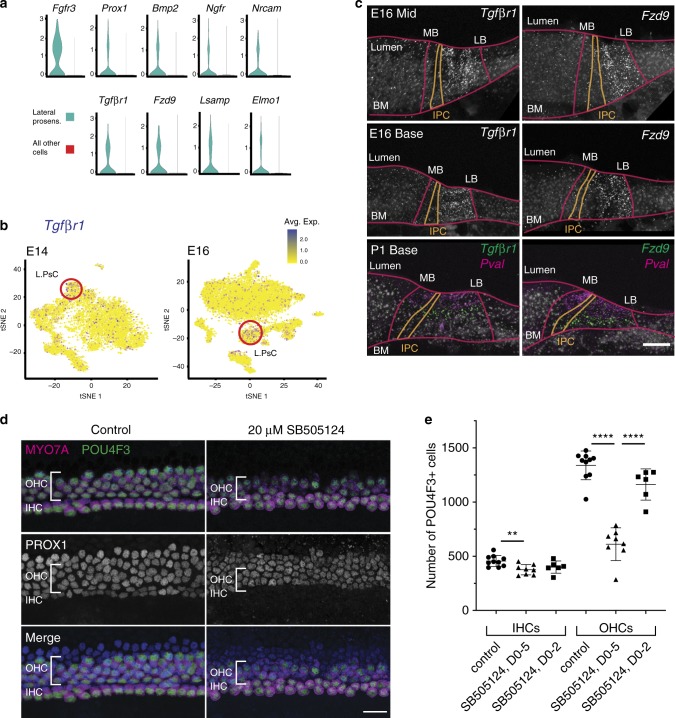
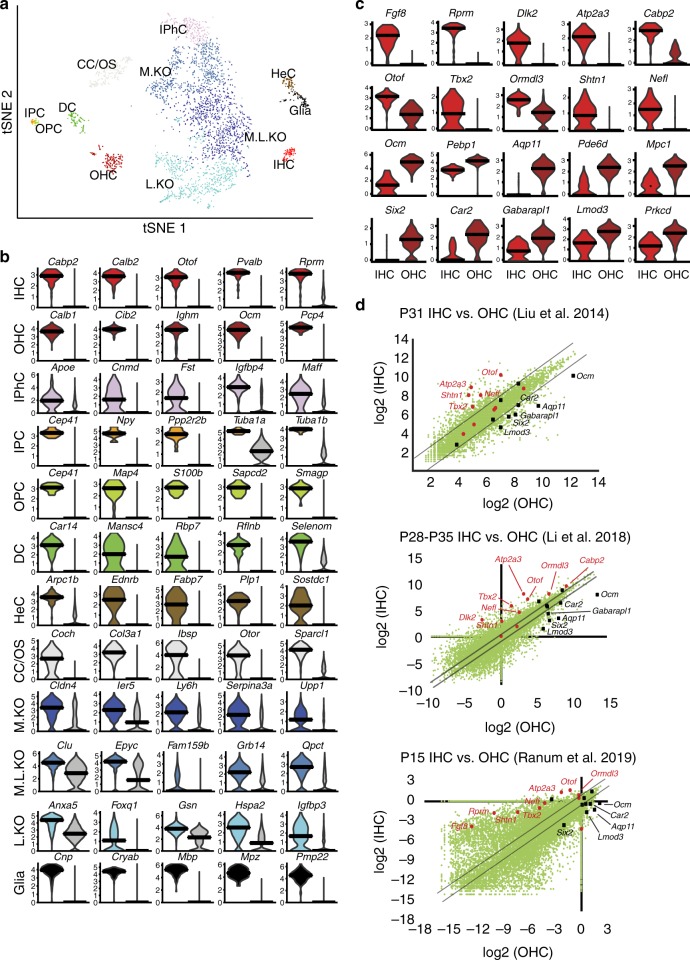
Mammalian hearing requires the development of the organ of Corti, a sensory epithelium comprising unique cell types. The limited number of each of these cell types, combined with their close proximity, has prevented characterization of individual cell types and/or their developmental progression. To examine cochlear development more closely, we transcriptionally profile approximately 30,000 isolated mouse cochlear cells collected at four developmental time points. Here we report on the analysis of those cells including the identification of both known and unknown cell types. Trajectory analysis for OHCs indicates four phases of gene expression while fate mapping of progenitor cells suggests that OHCs and their surrounding supporting cells arise from a distinct (lateral) progenitor pool. Tgfβr1 is identified as being expressed in lateral progenitor cells and a Tgfβr1 antagonist inhibits OHC development. These results provide insights regarding cochlear development and demonstrate the potential value and application of this data set.


Conflict of interest statement

The authors declare no competing interests

Figures

Fig. 1
Fig. 1. Characterization of cell types in the P1 cochlea.
a Line drawing of a cross section of the floor of the cochlear duct at P1. Distinct cell types within the organ of Corti (OC) are color coded. b Heat map for ~14,000 cochlear cells collected from four separate experiments at P1. Top 25 differentially expressed (DE) genes for the 15 identified clusters are shown. Cellular identity for each cluster is indicated by a color bar at the top of the heat map, which corresponds to the legend in a, and by a cell name at the bottom. c tSNE plot for the same cells as in b. Cluster identities are indicated. d Violin plots showing normalized log-transformed expression values for the top five DE genes for each cell type (color coded as in c) by comparison with all other P1 cells (gray on the right in each graph). Bars indicate median expression level. e Upper left panel, tSNE plot of cells determined to be derived from KO (between the OC and medial edge of the cochlear duct). Lower left panel, feature plot for the same cells as in the upper panel indicating high expression of Otoa, Calb1, and Fabp7 (based on color) in different clusters of cells. Lower right panel, cross sections through the cochlear duct at P1, illustrating expression of CALB1 in the medial region of KO and FABP7 directly adjacent to the OC (arrow; scale bars, 20 μm). Lowest panel shows high-magnification view of expression of FABP7 (arrow, gray scale) at the lateral KO border (green line; scale bar, 10 μm). Upper right panel, summary diagram of the spatial distribution of KO cell clusters at P1. HC hair cells, IPhC inner phalangeal cells/border cells, IPC inner pillar cells, OPC outer pillar cells, DC1/2 Deiters’ cells rows 1 and 2, DC3, Deiters’ cells row 3, HeC Hensen’s cells, CC/OSC Claudius cells/outer sulcus cells, IdC interdental cells, ISC inner sulcus cells, KO Kölliker’s organ cells, L.KO lateral Kölliker’s organ cells, M.KO medial Kölliker’s organ cells, OC90 OC90+ cells.
Fig. 2
Fig. 2. Validation of cell-type-specific markers at P1.
al In situ hybridization in P1 cochlear cross sections using smFISH. HCs are localized based on expression of Pvalb. Inset: feature plot for each gene in the P1 tSNE (high expression is indicated in blue). For all panels, the IHC is indicated with an arrow and the three OHCs are indicated by a bracket. HC markers Rprm b, Cd164l2 c, Ccer2 d, and Gng8 e, are all restricted to HCs. Tbx2 f, which was found only in the IHC cluster, is actually expressed in both IHCs and parts of KO. Sox2 g and Cdkn1b h, markers of SCs, are not expressed in HCs but are expressed in surrounding cells. Prss23 i shows a similar localization to cells surrounding the HCs. Npy j is only expressed in pillar cells located between the IHC and the first OHC. Fst k is localized in cells lateral to the OC and Pmch l is specific for Hensen’s cells located just adjacent to the third OHC. m Scatter plot comparing differential gene expression for P1 HCs and lateral SCs (see Methods section) with the results from Burns et al.. Green diamonds indicate average nTPM counts for HCs versus SCs in Burns et al.. Red circles indicate the values for the top 50 DE HC genes, and black squares indicate the values for top 50 DE SC genes from this study. See Supplementary Data 3 for a full list of gene names and values. Note that all P1 DE HC genes were more highly expressed in HC from Burns et al. as well. Six P1 DE HC genes and three P1 DE SC genes were not detected in either cell type (see Methods section for details and Supplementary Data 3 (Col. AC-AK for full list of gene identities)). Scale bar in l (same in ak), 50 μΜ.
Fig. 3
Fig. 3. Development of OHCs.
a tSNE plot for HCs isolated at P1. Both IHCs and OHCs can be clustered into immature and more mature cell groups based on gene expression. Arrow indicates trajectory of pseudotime (see c, d). b Dot plot showing differentially expressed genes between IHCs and OHCs. IHCs exclusively express several genes, including Fgf8, Atp2a3, Cabp2, Tbx2, and Shtn1. In contrast, a more limited number of genes are exclusively expressed in OHCs, including Calca, Serpina1c, Veph1, Cacng2, Strip2, and Msln1. This may reflect the delay in OHC maturation relative to IHC. c The P1 OHCs were analyzed using Monocle to generate a pseudotime trajectory. Analysis of gene expression profiles along pseudotime identified four different developmental phases. d Feature plots for a representative gene or genes from each of the four OHC developmental phases. Expression of Tmc1 was limited to the most mature IHCs and OHCs (purple circles) e Left-hand panel, tSNE plot based on identification of transcriptional regulons using SCENIC. The HC and SC clusters are indicated by red (HC) and blue (SC) circles. Right-hand panel, feature plots for representative HC-specific regulons (blue indicates high expression). Lhx3, Atoh1, Pou4f3, and Barhl1 are known HC-specific transcription factors (TFs). Brf2 and Usf2 have not been previously localized to hair cells but are present in HCs from previous bulk RNAseq experiments (see text). f Left-hand panel, expanded regulon tSNE for the HCs. Right-hand panel, two additional TFs, Bdp1 and Arnt1 are localized to HC subsets. HC hair cells, IPhC inner phalangeal cells/border cells, IPC inner pillar cells, OPC outer pillar cells, DC1/2 Deiters’ cells rows 1 and 2, DC3, Deiters’ cells row 3, HeC Hensen’s cells, CC/OSC Claudius cells/outer sulcus cells, IdC interdental cells, ISC inner sulcus cells, KO Kölliker’s organ cells, L.KO lateral Kölliker’s organ cells, M.KO medial Kölliker’s organ cells, OC90 OC90+ cells.
Fig. 4
Fig. 4. Medial and lateral prosensory cells are transcriptionally distinct by E14.
a, b tSNE plots for cochlear cells isolated from three separate experiments at E14 a and E16 b. Cluster identities are based on analysis of gene expression. c Feature plot illustrating expression of Cdkn1b (blue dots represent cells with high expression of Cdkn1b), Sox2 (green dots; high expression of Sox2), or high expression of both (red dots) in single cells isolated at E14. The red circle highlights concentrated expression. d Feature plot illustrating mutually exclusive expression of Fgfr3 (high expressing cells are in green) and Fgf20 (high expressing cells are in blue) in the same region as in c. The green and blue circles indicate concentrated expression of Fgfr3 (green) and Fgf20 (blue) e Left-hand panel, fate mapping of Fgfr3+ cells labeled between E14 and E16. Examples of cells that have developed as OHC, DC, IPC, and OPC are illustrated. Right-hand panel, histogram of fates of Fgfr3+-cells. Numbers indicate total number of cells for each cell type. Over 98% of all Fgfr3+ cells develop as cells within the lateral domain of the OC. Source data are supplied as a Source data file. f Trajectory analysis for MPsCs to IHCs and IPhCs, and for LPsCs to OHCs, DCs, IPCs, and OPCs. Upper panel color codes indicate cell types. Lower panel color codes indicate the time point of collection. MPsCs show a single bifurcation leading to IHCs or IPhCs. In contrast, while LPsCs transition to either DCs or OHCs, a clear bifurcation does not occur. HC hair cells, IPhC inner phalangeal cells/border cells, IPC inner pillar cells, OPC outer pillar cells, DC1/2 Deiters’ cells rows 1 and 2, DC3, Deiters’ cells row 3, HeC Hensen’s cells, CC/OSC Claudius cells/outer sulcus cells, IdC interdental cells, ISC inner sulcus cells, KO Kölliker’s organ cells, L.KO lateral Kölliker’s organ cells, M.KO medial Kölliker’s organ cells, OC90 OC90+ cells, L.PsC lateral prosensory cells, M.PsC medial prosensory cells. Scale bar in e, upper panel, 50 μm. Scale bar in e, lower panel, same for all cross sections, 10 μm.
Fig. 5
Fig. 5. Tgfβr1 activity is required for formation of the lateral prosensory domain.
a Violin plots for five genes, Fgfr3, Prox1, Bmp2, Ngf, and Nrcam, that had previously been reported to be expressed in the lateral prosensory domain. Bottom row illustrates examples with similar patterns of expression that have not been previously reported in prosensory cells. b Feature plots for Tgfβr1 at E14 and E16. Expression is concentrated in the LPsCs (red circles). See Fig. 4a, b for cluster identities. c smFISH confirms expression of Tgfβr1 and Fzd9 only in the lateral prosensory domain. Red lines indicate lumenal surface (lumen), basement membrane (BM), and approximate locations for medial (MB) and lateral (LB) boundaries of the OC. Approximate positions of IPCs (gold). At P1, expression of both Tgfβr1 and Fzd9 (green) is restricted to lateral SCs. HCs are marked with Pvalb (magenta). Minimum of two samples per probe with similar results. d Cochlear explants established on E14 and treated with either DMSO (control) or the Tgfβr1 antagonist SB505124 at 20 μM for 5 DIV. HC cytoplasm (anti-MYO7A, magenta) and nuclei (anti-POU4F3, green) and supporting cell nuclei (anti-PROX1, white or blue in merged image in bottom row) are labeled. Development of the lateral region of the OC is clearly disrupted (bracket), while the medial (IHC) region appears relatively unaffected. e Quantification of HC numbers per explant indicates a significant decrease in OHCs following 20 μM SB505124 treatment for 5 DIV (DO-5). A slight, but significant decrease in IHCs was also observed. Explants treated with 20 µM SB505124 for only 2 DIV (DO-2) followed by three additional days in control media did not show significant decreases in IHCs or OHCs. Data are presented as mean values ± SD, **p = 0.0093, ****p < 0.0001. n = 24 biologically independent explants (ten control, eight SB505124, DO-5, six SB505124, DO-2) with a total of n = 35,217 HCs counted over three separate experiments. Statistical test is one-way ANOVA followed by Tukey’s multiple comparison’s test. Source data are supplied as a Source data file. Scale bars in c and d, 20 μm.
Fig. 6
Fig. 6. Comparison of gene expression between IHCs and OHCs at P7 and in adults.
a tSNE plot for ~3400 cochlear cells isolated from three separate experiments at P7. Specific clusters for different cells types are labeled. b Violin plots showing relative expression of the top five differentially expressed (DE) genes for each cell type (color coded as in a) by comparison with all other P7 cells (gray on the right in each graph). c Violin plots for the top ten DE genes between P7 IHCs and OHCs. d Scatter plots comparing gene expression in IHCs vs. OHCs collected at the indicated ages in the indicated publications. Gray lines mark cutoffs for twofold differences in gene expression. Red and black dots indicate DE IHC and OHC genes, respectively, from P7. Names are included for those genes located outside of the twofold threshold. IHC inner HCs, OHC outer HCs, IPhC inner phalangeal cells/border cells, IPC inner pillar cells, OPC outer pillar cells, DC Deiters’ cells, HeC Hensen’s cells, CC/OS Claudius cells/outer sulcus cells, M.KO medial Kölliker’s organ cells, M.L.KO medial–lateral Kölliker’s organ cells, L.KO lateral Kölliker’s organ cells.
Fig. 7
Fig. 7. Localization of deafness genes.
Heat maps illustrating cell-type-specific expression (as a z-score for cell-type-averaged expression) for deafness-related genes in cochlear cell clusters from E14, E16, P1, and P7. Cluster identitities for each time point are indicated along the top of each heat map and disease classes are indicated on the Y-axis. Consistent with previous work, many deafness genes that are known to be expressed in HCs, such as Myo6, Myo7a, Myo3a, Cdh23, Pcdh15, Gipc3, and Cip2, show exclusive expression in HC clusters in particular at P7. Other genes that have been associated with hearing loss but not examined within the inner ear show expression in other cell types. For example, Ccbe1, which when mutated can lead to Hennekam syndrome, is only expressed in IPCs. ARHL age-related hearing loss, CRHL cisplatin-related hearing loss, NIHL noise-induced hearing loss, Syndr. syndromic.

References

    1. Wu DK, Kelley MW. Molecular mechanisms of inner ear development. Cold Spring Harb. Perspect. Biol. 2012;4:a008409. doi: 10.1101/cshperspect.a008409. - DOI - PMC - PubMed
    1. Van Laer L, Dietz H, Loeys B. Loeys-Dietz syndrome. Adv. Exp. Med. Biol. 2014;802:95–105. doi: 10.1007/978-94-007-7893-1_7. - DOI - PubMed
    1. Weir FW, Hatch JL, Muus JS, Wallace SA, Meyer TA. Audiologic outcomes in Ehlers-Danlos syndrome. Otol. Neurotol. 2016;37:748–752. doi: 10.1097/MAO.0000000000001082. - DOI - PubMed
    1. Burns JC, Kelly MC, Hoa M, Morell RJ, Kelley MW. Single-cell RNA-Seq resolves cellular complexity in sensory organs from the neonatal inner ear. Nat. Commun. 2015;6:8557. doi: 10.1038/ncomms9557. - DOI - PMC - PubMed
    1. Riazuddin S, et al. Alterations of the CIB2 calcium- and integrin-binding protein cause Usher syndrome type 1J and nonsyndromic deafness DFNB48. Nat. Genet. 2012;44:1265–1271. doi: 10.1038/ng.2426. - DOI - PMC - PubMed

Publication types

MeSH terms