. 2020 May 13;10(1):7908.
doi: 10.1038/s41598-020-64865-w.

The early local and systemic Type I interferon responses to ultraviolet B light exposure are cGAS dependent

Affiliations

The early local and systemic Type I interferon responses to ultraviolet B light exposure are cGAS dependent

Sladjana Skopelja-Gardner et al. Sci Rep. .

Abstract

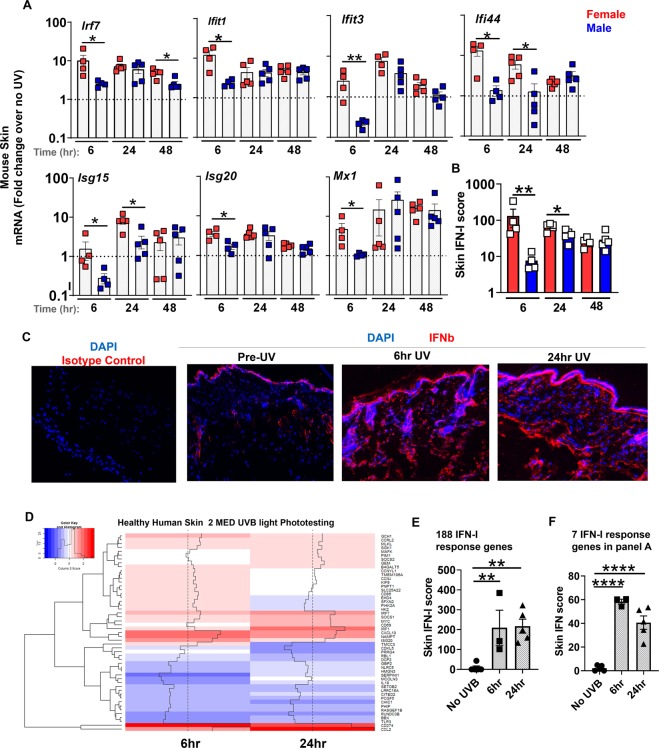
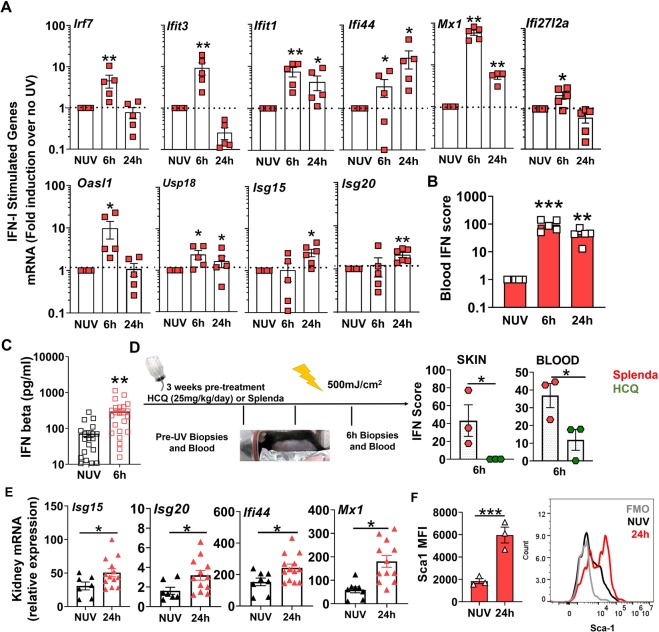
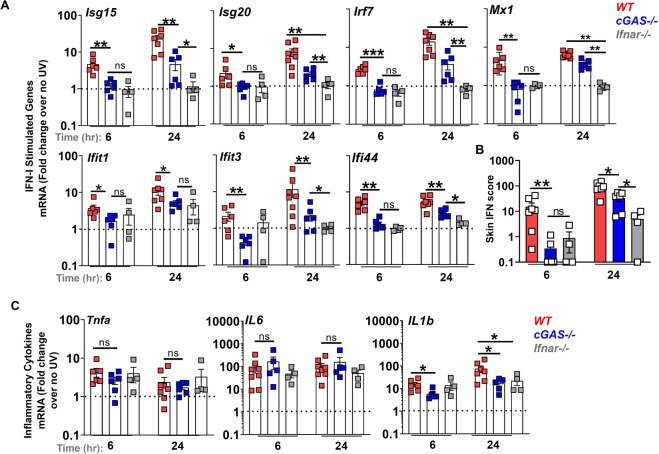
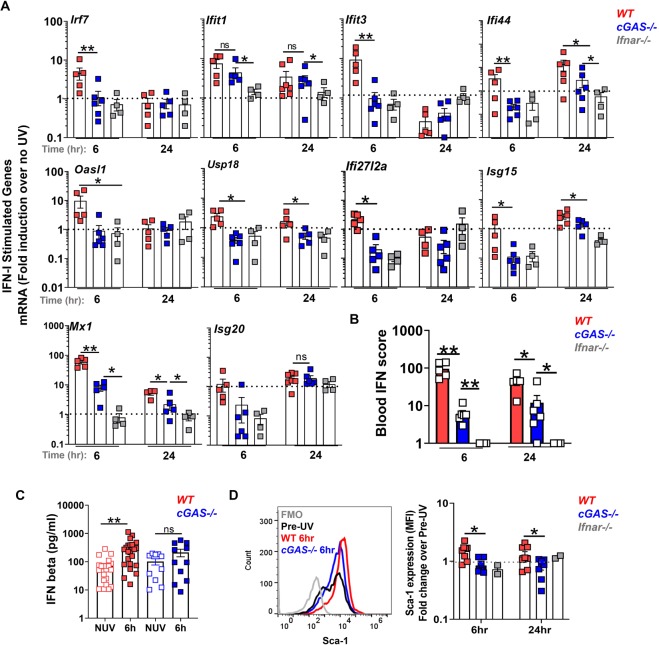
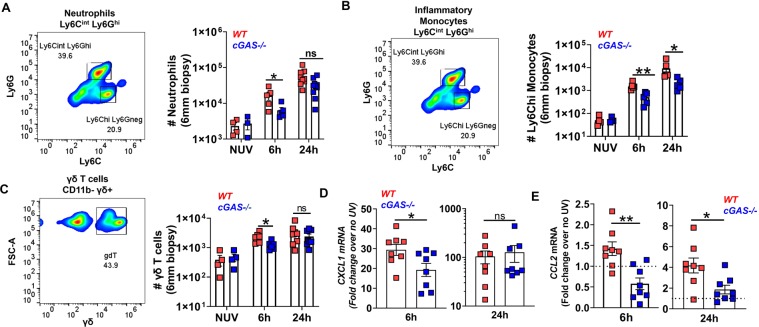
Most systemic lupus erythematosus (SLE) patients are photosensitive and ultraviolet B light (UVB) exposure worsens cutaneous disease and precipitates systemic flares of disease. The pathogenic link between skin disease and systemic exacerbations in SLE remains elusive. In an acute model of UVB-triggered inflammation, we observed that a single UV exposure triggered a striking IFN-I signature not only in the skin, but also in the blood and kidneys. The early IFN-I signature was significantly higher in female compared to male mice. The early IFN-I response in the skin was almost entirely, and in the blood partly, dependent on the presence of cGAS, as was skin inflammatory cell infiltration. Inhibition of cGAMP hydrolysis augmented the UVB-triggered IFN-I response. UVB skin exposure leads to cGAS-activation and both local and systemic IFN-I signature and could contribute to acute flares of disease in susceptible subjects such as patients with SLE.


Conflict of interest statement

The authors declare no competing interests.

Figures

Figure 1
Figure 1
A single exposure of skin to UVB light triggers an early ~10-fold induction of type I IFN-stimulated genes (ISG) in female mice and induces interferon gene expression in human skin. Age-matched male and female B6 mice were shaved dorsally and the whole back was exposed to one dose of UVB light (500 mJ/cm2). At 6, 24, and 48 hours after UV irradiation, (A) fold induction in the expression of type I IFN stimulated genes (ISG) in the skin: Irf7, Ifit1, Ifit3, Ifi44, Isg15, Isg20, and Mx1 was determined relative to baseline, i.e. non-irradiated skin (no UV). (B) Skin IFN scores for female and male B6 mice at 6, 24, and 48 hr after UVB light irradiation were calculated as sum of normalized expression levels of the same 7 ISG as discussed in Methods. (C) Immunofluorescence staining of IFNβ (red) in mouse skin tissues prior to, 6 hr, and 24 hr after UV exposure. Rabbit IgG isotype control staining in the left-most panel. Nuclear staining in DAPI. (D–F) IFN-I response was evaluated in healthy human volunteers 6 and 24 hr after UV exposure (2 MED UVB) and the ISG most differentially expressed shown in the heatmap (D). IFN scores were derived based on (E) 188 published IFN-I response genes or (F) 7 ISGs used in mouse studies (B). Statistical significance was determined by (A,B) Student’s t-test (n = 4–5; *p < 0.05, **p < 0.01) or (E,F) one-way ANOVA (n = 3–5; **p < 0.01, ****p < 0.0001).
Figure 2
Figure 2
Acute skin exposure to UVB light triggers a systemic IFN-I response. Female B6 mice were exposed to a single dose of UVB light as in Fig. 1, except that only half of the back was exposed. (A) Fold induction in ISG mRNA levels in the peripheral blood cells 6 and 24 hr after skin exposure to UVB light was determined relative to mRNA levels in the blood prior to UV. (B) Blood IFN scores were calculated as the sum of normalized expression levels of the 7 most highly expressed ISGs after UV exposure (Mx1, Ifit1, Ifit3, Ifi44, Usp18, Oasl1, and Ifi27l2a). (C) IFNβ concentration in plasma prior to UV (No UV, NUV) and 6 h after UV light exposure in B6 mice. (D) B6 mice were treated with hydroxychloroquine (HCQ, 25 mg/kg/day) or Splenda (controls) for 3 weeks prior to UV irradiation. Blood and skin IFN scores for both treatment groups were determined for samples 6 hr after UV exposure. (E) Relative expression of representative ISG transcripts in the perfused kidney tissues of B6 mice at baseline (no UV, NUV) or 24 h after skin exposure to UVB light. (F) Flow cytometry analysis of Sca-1 expression, presented as mean fluorescence intensity (MFI), on B cells in perfused kidney tissue prior to (NUV) and 24 h after UV exposure. Statistical significance was determined by Student’s t-test (n = 4–5 A,B; n = 23, C; n = 3, D; n = 7–12, E; n = 3, F; *p < 0.05, **p < 0.01, ***p < 0.001).
Figure 3
Figure 3
The early skin IFN response to UV light exposure is cGAS dependent. Age-matched female B6 (wild type, WT), cGAS−/−, and Ifnar1−/− mice were exposed to a single dose of UVB light as in Fig. 2. Skin biopsies were obtained prior to UVB light exposure and at 6 and 24 h after irradiation. (A) Fold change in the expression of IFN-I stimulated genes (ISG) in the skin was determined relative to baseline, i.e. non-irradiated skin (no UV). (B) Skin IFN scores at 6 and 24 hours after UVB were calculated as sum of normalized expression levels of the same 7 ISG. (C) Fold-induction in the expression of inflammatory cytokines Tnfa, Il-6, and Il1-β were determined relative to baseline, i.e. non-irradiated skin (no UV). Statistical significance was determined by Student’s t-test (n = 4–8; *p < 0.05, **p < 0.01, ***p < 0.001, ns = not significant).
Figure 4
Figure 4
Extracellular cGAMP exaggerates the IFN-I, but not the IL-6 or TNF, response to UVB light. (A) B6 mice were shaved and injected intradermally with 100 µM ENPP1 inhibitor (STF-1084) or Vehicle (PBS), 30 min prior to the exposure to UVB light as above. Skin was biopsied 16 hr after UV exposure. (B) Fold-change in ISG expression was determined relative to vehicle-treated non-UVB exposed skin in three treatment groups: STF1084 without UVB, vehicle with UVB, and STF-1084 with UVB. (C) Skin IFN scores in vehicle and STF-1084-treated UV exposed and non-exposed (NUV) skin were calculated as sum of normalized expression levels of the same 7 ISG as in Fig. 1. (D) Fold-induction in the expression of inflammatory cytokines Tnfa, Il-6, and Il1-β were determined relative to baseline, i.e. non-irradiated vehicle-treated skin (no UV). Statistical significance was determined by Student’s t-test (n = 5, 2 independent experiments; *p < 0.05, **p < 0.01, ns = not significant).
Figure 5
Figure 5
cGAS contributes to the systemic IFN-I response to skin UV light exposure. Age-matched female B6 (wild type, WT), cGAS−/−, and Ifnar1−/− mice were exposed to a single dose of UVB light as in Fig. 2. (A) Fold induction in ISG mRNA levels in the peripheral blood cells 6 and 24 hr after skin exposure to UVB light was determined relative to mRNA levels in the blood prior to UV. (B) Blood IFN scores for each genotype were calculated as the sum of normalized expression levels of the 7 most highly expressed ISGs after UV exposure (Mx1, Ifit1, Ifit3, Ifi44, Usp18, Oasl1, and Ifi27l2a). (C) IFNβ concentration in plasma prior to UV (No UV, NUV) and 6 h after UV light exposure in wild-type (WT) and cGAS−/− mice. (D) Flow cytometry analysis of Sca-1 expression on B cells in the blood of wild type (WT), cGAS−/−, and Ifnar−/− mice 6 and 24 hr after UVB exposure, presented as fold change relative to non-irradiated skin cells. Representative histograms are shown for B cell population. Statistical significance was determined by Student’s t-test (n = 4–6, A,B; n = 11–23, C; n = 3–8, D; *p < 0.05, **p < 0.01, ns = not significant).
Figure 6
Figure 6
The innate inflammatory response to UVB light in the skin is diminished in the absence of cGAS. Age-matched female B6 (wild type, WT) and cGAS−/− mice were exposed to a single dose of UVB light as in Figs. 2,3. Flow cytometry analysis of skin was performed and the number of (A) neutrophils (CD45 + CD11b + Ly6CintLy6Ghi), (B) inflammatory monocytes (CD45 + CD11b + Ly6ChiLy6Gneg), and (C) γδ + T cells (CD45 + CD11b-γδ + ) were determined based on total cell number per skin biopsy (6 mm). Skin biopsies from 2–4 mice were pooled for the 6 h time point. (D–E) Gene expression levels of CXCL1 (D) and CCL2 (E) in the skin were quantified by QPCR. Statistical significance was determined by Student’s t-test (n = 4–8; *p < 0.05, **p < 0.01, ns=not significant).

References

    1. Schmidt E, Tony HP, Brocker EB, Kneitz C. Sun-induced life-threatening lupus nephritis. Annals of the New York Academy of Sciences. 2007;1108:35–40. doi: 10.1196/annals.1422.004. - DOI - PubMed
    1. Foering K, et al. Characterization of clinical photosensitivity in cutaneous lupus erythematosus. J Am Acad Dermatol. 2013;69:205–213. doi: 10.1016/j.jaad.2013.03.015. - DOI - PMC - PubMed
    1. Baechler EC, et al. Interferon-inducible gene expression signature in peripheral blood cells of patients with severe lupus. Proceedings of the National Academy of Sciences of the United States of America. 2003;100:2610–2615. doi: 10.1073/pnas.0337679100. - DOI - PMC - PubMed
    1. Bennett L, et al. Interferon and granulopoiesis signatures in systemic lupus erythematosus blood. J Exp Med. 2003;197:711–723. doi: 10.1084/jem.20021553. - DOI - PMC - PubMed
    1. Crow MK, Kirou KA, Wohlgemuth J. Microarray analysis of interferon-regulated genes in SLE. Autoimmunity. 2003;36:481–490. doi: 10.1080/08916930310001625952. - DOI - PubMed

Publication types

MeSH terms