. 2020 May;581(7807):209-214.
doi: 10.1038/s41586-020-2256-2. Epub 2020 May 6.

Composition-dependent thermodynamics of intracellular phase separation

Affiliations

Composition-dependent thermodynamics of intracellular phase separation

Joshua A Riback et al. Nature. 2020 May.

Abstract

Intracellular bodies such as nucleoli, Cajal bodies and various signalling assemblies represent membraneless organelles, or condensates, that form via liquid-liquid phase separation (LLPS)1,2. Biomolecular interactions-particularly homotypic interactions mediated by self-associating intrinsically disordered protein regions-are thought to underlie the thermodynamic driving forces for LLPS, forming condensates that can facilitate the assembly and processing of biochemically active complexes, such as ribosomal subunits within the nucleolus. Simplified model systems3-6 have led to the concept that a single fixed saturation concentration is a defining feature of endogenous LLPS7-9, and has been suggested as a mechanism for intracellular concentration buffering2,7,8,10. However, the assumption of a fixed saturation concentration remains largely untested within living cells, in which the richly multicomponent nature of condensates could complicate this simple picture. Here we show that heterotypic multicomponent interactions dominate endogenous LLPS, and give rise to nucleoli and other condensates that do not exhibit a fixed saturation concentration. As the concentration of individual components is varied, their partition coefficients change in a manner that can be used to determine the thermodynamic free energies that underlie LLPS. We find that heterotypic interactions among protein and RNA components stabilize various archetypal intracellular condensates-including the nucleolus, Cajal bodies, stress granules and P-bodies-implying that the composition of condensates is finely tuned by the thermodynamics of the underlying biomolecular interaction network. In the context of RNA-processing condensates such as the nucleolus, this manifests in the selective exclusion of fully assembled ribonucleoprotein complexes, providing a thermodynamic basis for vectorial ribosomal RNA flux out of the nucleolus. This methodology is conceptually straightforward and readily implemented, and can be broadly used to extract thermodynamic parameters from microscopy images. These approaches pave the way for a deeper understanding of the thermodynamics of multicomponent intracellular phase behaviour and its interplay with the nonequilibrium activity that is characteristic of endogenous condensates.


Conflict of interest statement

Declaration of Interests

R.W.K. is a consultant for and D.M.M. is recently employed by Dewpoint Therapeutics, LLC. The remaining authors have no financial or non-financial conflicts of interest.

Figures

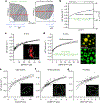
Figure 1.
Figure 1.. NPM1 lacks a fixed Cdil and Cden suggesting nucleoli undergo multicomponent mediated phase separation.
(A-B) Dependence of NPM1 total overexpression in the nucleus vs. (A) its measured concentration in the relevant dense phase (here ‘den’ referring to the GC of nucleoli) or (B) its apparent partition coefficient (i.e. the ratio of its concentration in the dense and dilute phases). (C) Dependence of the transfer free energy with increasing NPM1 in the dilute phase for mCherry (filled circles) vs. mGFP (open circles) tagged protein highlighting similar trends for the different florescent tagged proteins. Dashed lines represent mean confidence intervals to fits described in the methods. Red lines represent expected trends for single biomolecule phase separation.
Figure 2.
Figure 2.. G3BP1, Coilin, and DCP1A lack fixed Cdil and Cden in cells.
Relationship between the approximated total concentration and the dilute concentration for cells expressing variable amounts of fluorescently tagged (A) G3BP1, (B) Coilin, and (C) DCP1A. Relationship between the dilute and dense concentrations for cells expressing variable amounts of fluorescently tagged (D) G3BP1, (E) Coilin, and (F) DCP1A. Dashed lines represent mean confidence intervals to fits described in the methods. Statistical significance (p<0.01) for these increasing monotonic relationships between the axes are reported in the methods. Red points in (D) and (F) represent diffraction limited foci.
Figure 3.
Figure 3.. In silico validation of the composition-dependence of phase separation using Flory Huggins theory.
Phase separation of two (non-solvent) components, denoted #1 and #2, with their heterotypic interactions being equal, stronger, and weaker, then their homotypic interactions shown as black, blue, and orange, respectively for A-C. Note the dilute phase in the bottom left corner of the plot. (A) The initial dependence of the [#1]dil on [#1]tot at fixed [#2]tot such that phase separation will occur at the ‘goldilocks point’ being when [#1]tot=[#2]tot. Note the axes are normalized by the initial saturation (init sat) concentration, i.e. lowest [#1]tot where phase separation emerges. The dashed line is the 1:1 line where expected without phase separation. (B,C) Dependence on ΔGtr#1 (D) or ΔGtr#2 (E) as a function of [#1]dil. Circles indicate the location of the ‘goldilocks point’. (D) Dependence of the change in ΔGtr with respect to [#1]dil as a function of the heterotypic interaction strength χ12 (where more negative implies stronger heterotypic interactions) at the ‘goldilocks point’ for the transfer free energy of #1 and #2 as indicated.
Figure 4.
Figure 4.. In vitro destabilization of SURF6N partitioning by increasing its own or NPM1’s concentration.
Changes in the transfer free energy of SURF6N into multicomponent droplets as additional SURF6N (A) or NPM1 (B) is added on top of NPM1:SURF6N:rRNA ternary droplets as described in the methods. The number of droplets (in order of concentration) are N=122, 115, 105, 98, 98, 91, 74, and 99. Mean and standard deviation of error bars are shown. (C) Phase diagram in vitro in the presence of 25 ng/μL wheatgerm rRNA, 5 μM SURF6N, and various concentrations of NPM1. Units shown are absorbance units corrected for background, quantum yield differences between the two phases, and the (non-linear) fraction labeled of NPM1. (D) Dependences of the phase diagram as additional NPM1 is added. As in C, NPM1 concentrations in the dense or dilute phases are indicative of total NPM1. Hyperbolic fits shown highlight that the largest changes with NPM1 addition are from an increase in NPM1’s dilute phase concentration and a decrease in SURF6N’s dense phase concentration. To assess significance, yaxes in D are shown from zero arbitrary units (A.U.) to 2.5 times the mean of all points shown.
Figure 5.
Figure 5.. R proteins and NPM1 ΔΔGtr.
Change in the transfer free energy of r-proteins RPL23A and RPL5 compared to that for SURF6 as NPM1 concentration is increased.
Figure 6.
Figure 6.. ActD decreases nucleolus size.
Nucleolar fraction of image area as a function of time after addition of ActD in individual cells expressing NPM1-mCherry. Colors indicate same cells as in Fig. 3G, right.
Figure 7.
Figure 7.. Characterization of Corelet non-ideality and extrapolation from high valence.
(A) Dependence on the transfer free energy for the N-terminal half of NPM1 (NC)-sspB in cells without the core expressed (orange being a ΔGtr) or with the indicated valences following core activation (black being a ΔΔGtrNC-Core). The ΔΔGtrNC-Core in this case is the energetic difference between the NC and core channels which is approximately the energetic difference for transferring an additional NC to the core at that valence. (B) At valences higher then 24, the transfer free energy is approximated as quadratic and extrapolated back to a valence of 24 to obtain the transfer free energy at this valence. (C) Transfer free energy reported from the sspB channel as a function of valence which is weighted by the number of sspB molecules (due to the number of mCherry molecules observed being proportional to each molecule’s valence as opposed to the core where it is always constant at 24 GFPs). Red point represents extrapolated value and mean confidence error as determined in (B).
Figure 8.
Figure 8.. Controls for ribosomal mimics.
SDS-PAGE (A) and denaturing agarose gel (B) detailing purity of reagents used in experiments presented in Figure 4D and E. (C) Microscopy image for 10 μM NPM1–594 droplets formed with 5% PEG without any rRNA showing limited florescence indicating neither NPM1 nor PEG binds SYTO 40 and the droplet environment does not promote florescence of SYTO 40. (D) Phase separation assessed by turbidity at fixed 50 μg/ml indicated ribosomal substrate as a function of NPM1 concentration. The dashed gray line indicates where phase separation typically is observed in microscopy measurements.
Figure 1.
Figure 1.. Multicomponent LLPS results in non-fixed Csat and the emergence of a concentration-dependent phase stability.
(A) Example images of cells (from N=79 quantified in B) expressing NPM1-mCherry denoting total nuclear concentration (Ctot) and nucleoplasmic concentration (Cdil) of NPM1-mCherry in the top and within the image, respectively. The white dashed lines denote the nuclear boundary as defined by NPM1. Scale bar is 10 microns. (B) Concentration of NPM1-mCherry in the nucleoplasm (Cdil) with respect to the total NPM1-mCherry concentration in the nucleus (Ctot). The expected trend for a single Csat is shown in red as described in the text. (C) Graphical representation of phase diagrams for both single and multicomponent LLPS showing fixed and non-fixed Cdil (or Csat), respectively. Component concentration changes along the red line; within the gray-shaded region, molecules phase separate into two phases whose concentrations (curved arrows) are defined by the dashed tie lines. For a multicomponent system, the 2-dimensional phase diagram is a slice of a higher dimensional one, resulting in skewed tie lines and non-fixed Csat. (D) Example images of cells expressing OptoDroplet constructs with optoDDX4 (top row from N=19 quantified in E) or optoG3BP1 (bottom row from N=49 quantified in F) with the cytoplasmic (circles)/nucleoplasmic (squares) concentrations before and after full activation, respectively. Cells shown as red points exhibit condensates upon activation (none had condensates prior to activation); dashed lines represent mean confidence intervals for cells with foci for constant and linear fits in optoDDX4 and optoG3BP1, respectively. OptoG3BP1 experiments are arsenite-stressed cells with G3BP1A/B knocked out; optoDDX4 data reproduced from. Here scale bars are 5 microns. Line scans shown correspond to intensity traces before and after activation in black and blue, respectively.
Figure 2.
Figure 2.. Determining the contribution of heterotypic and homotypic interactions driving condensate formation in vivo and in vitro.
(A) Schematic illustrating the connection between the phase diagram and the transfer free energy of a component when heterotypic interactions are equal (left) to or stronger (right) compared to homotypic interactions. (B) Accompanying schematic detailing the qualitative change in the transfer free energy of component 1 (i.e. C1 in A) with an increase in its expression for the two cases in (A). (C) Thermodynamic dependence of NPM1 (-mCherry filled, -GFP empty) transfer from the nucleoplasm into the nucleolus, as a function of its increased expression (concentration in the nucleoplasm). Inset, image from Fig 1A to highlight that these data represent a reanalysis of those experiments. (D) In vitro reconstitution experiments showing ΔGtr for NPM1 as a function of added NPM1. Image of NPM1 droplets with 5% PEG (bottom right) and of ternary NPM1:SURF6N:rRNA droplets in buffer (top right). ΔGtr for Coilin-EYFP (E), G3BP1 (F, -GFP empty, -mCherry filled), and DCP1A-EYFP (G) from the dilute phase (i.e. nucleoplasm or cytoplasm) to Cajal bodies, arsenite-induced Stress granules, and P-bodies (i.e. dense phases), respectively. For all proteins here, a higher Cdil results from an increase in its expression (Fig 1B, Extended Data Fig. 2A-C). All scale bars are 10 microns.
Figure 3.
Figure 3.. Heterotypic interactions between nucleolar proteins and rRNA underly nucleolar thermodynamics.
(A) Schematic of proposed mechanism for the dilution of non-NPM1 molecular interactions in the dense phase due to NPM1 overexpression. Only relevant species shown for clarity. (B) Example images for cells (from N=102 quantified in C/D) expressing NPM1-mCherry and SURF6-GFP with high and low expression of NPM1 as indicated. Scale bar is 10 microns. (C) Change in the transfer free energy of SURF6 with overexpression of NPM1 plotted against SURF6 concentration (colors are different concentrations of NPM1 in μM as indicated with mean and range values, open circles are cells without additional NPM1 expressed). The method of calculating ΔΔGtr at a referenced nucleoplasmic SURF6 concentration is shown via arrows and displaced lines in (C) and (D) shown as a function of NPM1 concentration with the same colored concentrations as C. (E) Schematic of ActD treatment on nucleoli with time. (F) Images of cells at indicated times post ActD treatment (from N=4 NPM1-tagged time series). Corresponding quantification for NPM1 cells is shown in Extended Data Fig. 5. Scale bar is 5 microns. Dependence of ΔΔGtr of (G) NPM1 and SURF6 and (H) RPL23A and RPL5 with ActD treatment. Each color for each plot represents an individual cell followed with time. Black points are cells measured at the indicated time points. Schematics highlighting the differences in suggested interactions with rRNA are shown above G and H.
Figure 4.
Figure 4.. Composition-dependent heterotypic LLPS drives specific ribosomal subunit exclusion.
(A) Top, schematic NPM1 valency as a function of rRNA folding/processing in the nucleolus and bottom, schematic of NPM1 valency on ferritin “cores” using the Corelet optogenetic system. (B) Images of a cell highlighting the partitioning of the “cores” (ferritin-iLID-GFP) before light (e.g. low effective valence) and after light (e.g. high effective valence) upon which NPM1-C binding sites on the core are saturated in this cell. Quantification is shown below corresponding to the dashed line shown in the images. (C) Corresponding quantification of the dependence for the ΔGtr of the core as a function of the valence in the GC after light activation. Dotted lines are fits to data. (D) ΔGtr measured by incubation with 6.5 μM SYTO 40 to approximate the transfer free energies of 16S rRNA or the 30S small ribosomal subunit (at a total of 5 μg/ml) into droplets formed with NPM1 (10 μM) and 5% PEG droplets as indicated. Error bars represent standard deviation from N=118, 64 droplets for 16S and 30S, respectively. Top representative images. (E) Turbidity assay of indicated concentration of NPM1 with either the 16S rRNA or the 30S small ribosomal subunit in blue and green, respectively. 50 μg/ml of the RNA species is added; validation of protein and RNA components in Extended Data Fig. 7. 16S is labeled via a morpholino approach as described in the methods. Top, microscopy images with 10 μM NPM1 with indicated RNA species. (F) Proposed mechanism for ribosomal subunit exclusion from the GC of the nucleolus driven by thermodynamics of nucleolar LLPS.

Comment in

References

    1. Shin Y. & Brangwynne CP Liquid phase condensation in cell physiology and disease. Science 357, (2017). - PubMed
    1. Banani SF, Lee HO, Hyman AA & Rosen MK Biomolecular condensates: organizers of cellular biochemistry. Nat. Rev. Mol. Cell Biol 18, 285–298 (2017). - PMC - PubMed
    1. Nott TJ et al. Phase transition of a disordered nuage protein generates environmentally responsive membraneless organelles. Mol. Cell 57, 936–947 (2015). - PMC - PubMed
    1. Shin Y. et al. Spatiotemporal Control of Intracellular Phase Transitions Using Light-Activated optoDroplets. Cell 168, 159–171.e14 (2017). - PMC - PubMed
    1. Wang J. et al. A Molecular Grammar Governing the Driving Forces for Phase Separation of Prion-like RNA Binding Proteins. Cell 174, 688–699.e16 (2018). - PMC - PubMed

Publication types

MeSH terms