. 2020 May;581(7807):184-189.
doi: 10.1038/s41586-020-2270-4. Epub 2020 May 13.

Rapid growth of new atmospheric particles by nitric acid and ammonia condensation

Mingyi Wang #  1   2 Weimeng Kong #  3 Ruby Marten  4 Xu-Cheng He  5 Dexian Chen  1   6 Joschka Pfeifer  7 Arto Heitto  8 Jenni Kontkanen  5 Lubna Dada  5 Andreas Kürten  9 Taina Yli-Juuti  8 Hanna E Manninen  7 Stavros Amanatidis  3 António Amorim  10 Rima Baalbaki  5 Andrea Baccarini  4 David M Bell  4 Barbara Bertozzi  11 Steffen Bräkling  12 Sophia Brilke  13 Lucía Caudillo Murillo  9 Randall Chiu  14 Biwu Chu  5 Louis-Philippe De Menezes  7 Jonathan Duplissy  5   15 Henning Finkenzeller  14 Loic Gonzalez Carracedo  13 Manuel Granzin  9 Roberto Guida  7 Armin Hansel  16   17 Victoria Hofbauer  1   2 Jordan Krechmer  18 Katrianne Lehtipalo  5   19 Houssni Lamkaddam  4 Markus Lampimäki  5 Chuan Ping Lee  4 Vladimir Makhmutov  20 Guillaume Marie  9 Serge Mathot  7 Roy L Mauldin  1   2   21 Bernhard Mentler  16 Tatjana Müller  9 Antti Onnela  7 Eva Partoll  16 Tuukka Petäjä  5 Maxim Philippov  20 Veronika Pospisilova  4 Ananth Ranjithkumar  22 Matti Rissanen  5   23 Birte Rörup  5 Wiebke Scholz  16   17 Jiali Shen  5 Mario Simon  9 Mikko Sipilä  5 Gerhard Steiner  16   24 Dominik Stolzenburg  5   13 Yee Jun Tham  5 António Tomé  25 Andrea C Wagner  9   14 Dongyu S Wang  4 Yonghong Wang  5 Stefan K Weber  7 Paul M Winkler  13 Peter J Wlasits  13 Yusheng Wu  5 Mao Xiao  4 Qing Ye  1   2   26 Marcel Zauner-Wieczorek  9 Xueqin Zhou  4 Rainer Volkamer  14 Ilona Riipinen  27 Josef Dommen  4 Joachim Curtius  9 Urs Baltensperger  4 Markku Kulmala  5   15   28   29 Douglas R Worsnop  5   18 Jasper Kirkby  7   9 John H Seinfeld  3 Imad El-Haddad  4 Richard C Flagan  3 Neil M Donahue  30   31   32   33
Affiliations

Rapid growth of new atmospheric particles by nitric acid and ammonia condensation

Mingyi Wang et al. Nature. 2020 May.

Abstract

A list of authors and their affiliations appears at the end of the paper New-particle formation is a major contributor to urban smog1,2, but how it occurs in cities is often puzzling3. If the growth rates of urban particles are similar to those found in cleaner environments (1-10 nanometres per hour), then existing understanding suggests that new urban particles should be rapidly scavenged by the high concentration of pre-existing particles. Here we show, through experiments performed under atmospheric conditions in the CLOUD chamber at CERN, that below about +5 degrees Celsius, nitric acid and ammonia vapours can condense onto freshly nucleated particles as small as a few nanometres in diameter. Moreover, when it is cold enough (below -15 degrees Celsius), nitric acid and ammonia can nucleate directly through an acid-base stabilization mechanism to form ammonium nitrate particles. Given that these vapours are often one thousand times more abundant than sulfuric acid, the resulting particle growth rates can be extremely high, reaching well above 100 nanometres per hour. However, these high growth rates require the gas-particle ammonium nitrate system to be out of equilibrium in order to sustain gas-phase supersaturations. In view of the strong temperature dependence that we measure for the gas-phase supersaturations, we expect such transient conditions to occur in inhomogeneous urban settings, especially in wintertime, driven by vertical mixing and by strong local sources such as traffic. Even though rapid growth from nitric acid and ammonia condensation may last for only a few minutes, it is nonetheless fast enough to shepherd freshly nucleated particles through the smallest size range where they are most vulnerable to scavenging loss, thus greatly increasing their survival probability. We also expect nitric acid and ammonia nucleation and rapid growth to be important in the relatively clean and cold upper free troposphere, where ammonia can be convected from the continental boundary layer and nitric acid is abundant from electrical storms4,5.


Conflict of interest statement

The authors declare no competing interests.

Figures

Fig. 1
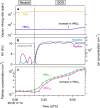
Fig. 1. Rapid growth events observed in the CERN CLOUD chamber.
a, Particle nucleation and growth (particle growth rate, ddp/dt) at −10 °C from a mixture of 0.44 pptv sulfuric acid and 1,915 pptv ammonia at 60% relative humidity. Particles form and grow to roughly 10 nm in 30 min. The black curve shows the linear fit to the 50% appearance times. b, Particle formation and growth under identical conditions to those in a, but with the addition of 24 pptv of nitric acid vapour formed via NO2 oxidation. Once particles reach roughly 5 nm, they experience rapid growth to much larger sizes, reaching more than 30 nm in 45 min. c, Observed growth rates after activation versus the product of measured nitric acid and ammonia levels at +5 °C and −10 °C. The point corresponding to the rapid growth regime for dp > 6 nm in b is a black-outlined green circle, and the point corresponding to Fig. 2 is a black-outlined purple square. Growth rates at a given vapour product are substantially faster at −10 °C than at +5 °C, consistent with semivolatile condensation that is rate limited by ammonium nitrate formation. Error bars are 95% confidence limits on the fitting coefficients used to determine growth rates. The overall systematic scale uncertainties of ±10% on the NH3 mixing ratio and ±25% on the HNO3 mixing ratio are not shown. Source Data
Fig. 2
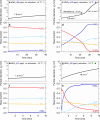
Fig. 2. Chemical composition during a rapid growth event at +5 °C and 60% relative humidity.
This growth event is indicated in Fig. 1c with a black-outlined purple square. a, Gas-phase nitric acid (NO3), ammonia (NH3) and sulfuric acid (H2SO4) mixing ratios versus time in an event initiated by SO2 oxidation, with constant nitric acid and ammonia. b, Particle diameters and number distributions versus time, showing a clean chamber (to the left of the vertical dotted line), then nucleation after sulfuric acid formation and rapid growth once particles reach 2.3 nm. Black curves are linear fits to the 50% appearance times. c, Particle volume distributions from the same data, showing that 200-nm particles dominate the mass after 15 min. 1 μcc = 1 cm−6d, FIGAERO thermogram from a 30-min filter sample after rapid growth (c.p.s., counts per second). The particle composition is dominated by nitrate with a core of sulfate, consistent with rapid growth by ammonium nitrate condensation on an ammonium sulfate (or bisulfate) core (note the different y-axis scales; the instrument is not sensitive to ammonia). A thermogram from just before the formation event shows no signal from either nitrate or sulfate, indicating that vapour adsorption did not interfere with the analysis. Source Data
Fig. 3
Fig. 3. Phase space for rapid growth and nucleation.
a, Ammonium nitrate saturation ratios versus gas-phase nitric acid and ammonia mixing ratios at 60% relative humidity. The coloured lines (slope = −1) represent S = 1 (bold), S = 5 (dashed) and S = 25 (dotted), at −10 °C (green) and +5 °C (purple). The slope = +1 dot-dashed grey line indicates a 1:1 ammonia:nitric-acid stoichiometry; the phase space to the upper left of this line is nitric-acid limited. Observed activation diameters (in nm) for measured nitric-acid–ammonia pairs are plotted as numbers inside solid circles and squares; open symbols show no activation. Activation occurs only for S values of more than 1, and the activation diameter decreases as S increases. Points from MABNAG simulations are shown with open triangles for no activation and filled triangles for activation; simulations indicated with diamonds are shown in detail in Fig. 4 and Extended Data Fig. 4. Points from runs shown in Figs. 1, 2 are emphasized with a thick black outline. b, Mixing ratios for ammonia and nitric acid vapour during a pure ammonium nitrate nucleation scan from −16 °C to −24 °C. c, Particle-formation (nucleation) rates (J1.7) during the nucleation scan, showing a strong inverse relationship with temperature at constant HNO3 and NH3, with H2SO4 concentrations of less than 0.002 pptv and relative humidity starting at 60% and ending at 40%. The bars indicate 30% estimated total errors on the nucleation rates, although the overall systematic scale uncertainties of ±10% on the NH3 mixing ratio and ±25% on the HNO3 mixing ratio are not shown. Source Data
Fig. 4
Fig. 4. Conditions for rapid growth.
Persistent supersaturations of ammonia and nitric acid with respect to ammonium nitrate will be sustained by inhomogeneity in urban conditions with high source strength. This will be sufficient to accelerate particle growth in the range 1–10 nm, where survival is threatened by the high coagulation sink of pre-existing particles from pollution. a, Conceptual image of urban conditions, where inhomogeneities in the concentrations of ammonia and nitric acid vapour and in temperatures are caused by non-uniform sources and large-scale eddies. b, Particles nucleate and grow slowly as (base-stabilized) sulfate (red). The activation size (shown with dp on the x-axis) correlates inversely with the ammonium nitrate saturation ratio (shown qualitatively on the y-axis), as indicated by the dashed curve. Available concentrations of gas-phase nitric acid can exceed those of sulfuric acid by a factor of 1,000, so modest supersaturation drives rapid growth (blue) above an activation diameter determined by particle curvature (the Kelvin term). c, d, Monodisperse thermodynamic growth calculations (from MABNAG simulations) for high (c) and low (d) saturation ratios of ammonium nitrate, corresponding to b and to the closed and open diamonds towards the upper right in Fig. 3a. For a saturation ratio near 4, activation is predicted to occur near 4 nm, consistent with our observations. Source Data
Extended Data Fig. 1
Extended Data Fig. 1. New-particle-formation events observed in various remote and urban environments (see Extended Data Table 3 for a complete set of references).
a, Growth rates (GR) versus condensation sinks (CS), showing that both are higher in polluted urban environments than in other environments. b, Particle-formation rates (J) versus a measure of particle loss via coagulation (CS × 104/GR, similar to the the McMurry L parameter), showing high new-particle-formation rates in urban conditions where the condensation sinks were so high compared to the growth rate that survival of nucleated particles should be very low. J and GR were calculated over the size range from a few nanometres to over 20 nm, except for J at Shanghai and Tecamac, which were calculated from 3 nm to 6 nm. The bars indicate 1σ total errors. Source Data
Extended Data Fig. 2
Extended Data Fig. 2. Activation diameter of newly formed particles.
a, Determination of the activation diameter, dact, from a rapid growth event at +5 °C, in the presence of nitric acid, ammonia and sulfuric acid. The solid orange trace in the insert indicates the first size distribution curve that exhibited a clear bimodal distribution, which appeared roughly 7 min after nucleation. We define the activation diameter as the largest observed size of the smaller mode. In this case, dact = 4.7 nm, which agrees well with the value obtained from MABNAG simulations (roughly 4 nm) under the same conditions as in Fig. 4. b, Activation diameter versus vapour product. Measured activation diameters at a given temperature correlate inversely with the product of nitric acid and ammonia vapours, in a log-log space. An amount of vapour product that is approximately one order of magnitude higher is required for the same dact at +5 °C than at −10 °C, because of the higher vapour pressure (faster dissociation) of ammonium nitrate when it is warmer. c, Equilibrium particle diameter (dp) at different saturation ratios of ammonium nitrate, calculated according to nano-Köhler theory. Purple curves are for +5 °C and green curves are for −10 °C (as throughout this work). The line type shows the diameter of the seed particle (ds). The maximum of each curve corresponds to the activation diameter (dact). A higher supersaturation is required for activation at lower temperature. Source Data
Extended Data Fig. 3
Extended Data Fig. 3. A typical measurement sequence.
Nucleation was carried out purely from nitric acid and ammonia, with no sulfuric acid (measured to less than 5 × 104 cm−3 or 2 × 10−3 pptv), as a function of coordinated universal time (UTC), at 60% relative humidity and −25 °C. a, Gas-phase ammonia and nitric acid mixing ratios. The run started with injection of the nitric acid and ammonia flow into the chamber to reach chosen steady-state values near 30 pptv and 1,500 pptv, respectively. The nitric acid flow was increased at 5:53 on 14 November 2018 to prove consistency. b, Clearing-field voltage and ion concentrations. Primary ions were formed from galactic cosmic rays (GCR). The clearing-field high voltage (HV) was used to sweep out small ions at the beginning of the run, and turned off at 05:21 on 14 November 2018 to allow the ion concentration to build up to a steady state between GCR production and wall deposition. c, Particle concentrations at two cut-off sizes (1.7 nm and 2.5 nm). Particles formed slowly in the chamber under ‘neutral’ conditions with the HV clearing field on and thus without ions present. The presence of ions (‘GCR’ condition) caused a sharp increase in the particle-number concentration by about one order of magnitude, with a slower approach to steady state because of the longer wall-deposition time constant for the larger particles. Particle numbers rose again with rising nitric acid. Source Data
Extended Data Fig. 4
Extended Data Fig. 4. Comparison of growth rates and chemical composition in four simulations at +5 °C and −10 °C with the thermodynamic model MABNAG.
The simulation points are shown in Fig. 3a (filed diamonds, with activation; open diamonds, without activation). a, c, e, g, Temporal evolution of the particle diameter. b, d, f, h, Temporal evolution of the particle-phase chemical composition. The left-hand column (a, b, e, f) shows simulations without activation. The right-hand column (c, d, g, h) shows simulations with activation. We set the HNO3 mixing ratios at 80 pptv and 400 pptv with 1,500 pptv NH3 at +5 °C, and set the HNO3 mixing ratios at 20 pptv and 0.5 pptv with 1,500 pptv NH3 at −10 °C, to simulate unsaturated (a, b, e, f) and supersaturated (c, d, g, h) conditions, respectively. All other conditions were held constant for the simulations, with the [H2SO4] at 2 × 107 cm−3 and relative humidity at 60%. Activation corresponds to a rapid increase in the nitric acid (nitrate) mass fraction; the simulations for activation conditions suggest that water activity may be an interesting variable influencing activation behaviour. The activated model results (c, d, g, h) confirm that supersaturated nitric acid and ammonia lead to rapid growth of nanoparticles. The simulated activation diameter at +5 °C is roughly 4 nm, similar to that from the chamber experiment (4.7 nm, Fig. 3a); at −10 °C the simulated activation diameter is less than 2 nm, smaller than observed. Source Data
Extended Data Fig. 5
Extended Data Fig. 5. Combined particle-size distribution and total concentrations from four particle characterization instruments.
a, Combined size distributions, nN°(dp)=dN/d(logdp), from four electrical mobility particle-size spectrometers of different, but overlapping, detection ranges. The DMA-Train, nSEMS and nano-SMPS data were averaged every five minutes to coordinate with the long-SMPS scanning time resolution. The tail of the size distribution of large particles outside the detection range was extrapolated by fitting a lognormal distribution. b, Comparison of the integrated number concentrations from the combined size distributions in a with total number counts obtained from fixed-cutoff-size condensation particle counters. We obtained the total number concentration of particles, Nt(dp0), above a cutoff size, dp0, by integrating the particle-size distribution using: Nt=dp0{nN(dp)×ηUCPC}ddp, applying the size-dependent detection efficiency, ηUCPC, to adjust the integrated total number concentration. We plot the total number concentrations for three different cutoff sizes (dp0) of 1.7 nm, 2.5 nm and 3.0 nm, obtained every 5 min, with coloured symbols as shown in the legend. We also plot measured total number concentrations from two instruments: the Airmodus A11 nCNC-system at nominal cutoff sizes of 1.7 nm and 2.5 nm, and a TSI 3776 UCPC with a nominal cutoff size of 2.5 nm. The Airmodus A11 nCNC-system consists of an A10 PSM and an A20 CPC, which determined both the size distribution of 1–4-nm aerosol particles and the total number concentration of particles smaller than 1 μm (ref. ). The TSI 3776 UCPC has a rapid response time and so, rather than the 5-min basis for the other points, we plot the values from this instrument with a dashed curve. Source Data
Extended Data Fig. 6
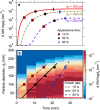
Extended Data Fig. 6. Determination of growth rate using the appearance-time method.
a, Logarithmic interpolated time-dependent growth profiles for particles with diameters of 100 nm, 150 nm and 200 nm. Three appearance times, when particle number concentrations reached 10%, 50%, and 90% of their maximum, are labelled with different symbols for the three different diameters. b, Growth-rate calculation for a rapid growth event (as in Fig. 2) above the activation diameter. The growth rates, in nm h−1, that we report here are the slopes of linear fits to the 50% (among 10%, 50% and 90%) appearance times calculated from all sizes above the activation diameter (the slope of the solid black line and the black circles in b). Source Data
Extended Data Fig. 7
Extended Data Fig. 7. Saturation ratio as a function of temperature.
At constant nitric acid and ammonia, a decline in temperature leads to an exponential increase in the saturation ratio of ammonium nitrate, shown as the product of nitric acid and ammonia vapour concentration. With an adiabatic lapse rate of −9 °C km−1 during adiabatic vertical mixing, upward transport of a few hundred metres alone is enough for a saturated nitric acid and ammonia air parcel to reach the saturation ratio capable of triggering rapid growth at a few nanometres. Source Data

Comment in

References

    1. Stanier, C. O., Khlystov, A. Y. & Pandis, S. N. Nucleation events during the Pittsburgh Air Quality Study: description and relation to key meteorological, gas phase, and aerosol parameters. Aerosol Sci. Technol. 38, 253–264 (2004).
    1. Yao, L. et al. Atmospheric new particle formation from sulfuric acid and amines in a Chinese megacity. Science361, 278–281 (2018). - PubMed
    1. Kulmala, M., Kerminen, V.-M., Petäjä, T., Ding, A. J. & Wang, L. Atmospheric gas-to-particle conversion: why NPF events are observed in megacities? Faraday Discuss. 200, 271–288 (2017). - PubMed
    1. Höpfner, M. et al. Ammonium nitrate particles formed in upper troposphere from ground ammonia sources during Asian monsoons. Nat. Geosci. 12, 608–612 (2019).
    1. Williamson, C. J. et al. A large source of cloud condensation nuclei from new particle formation in the tropics. Nature574, 399–403 (2019). - PubMed

Publication types