. 2020 May;26(5):688-692.
doi: 10.1038/s41591-020-0856-x. Epub 2020 May 11.

Elevated serum interleukin-8 is associated with enhanced intratumor neutrophils and reduced clinical benefit of immune-checkpoint inhibitors

Affiliations

Elevated serum interleukin-8 is associated with enhanced intratumor neutrophils and reduced clinical benefit of immune-checkpoint inhibitors

Kurt A Schalper et al. Nat Med. 2020 May.

Abstract

Serum interleukin-8 (IL-8) levels and tumor neutrophil infiltration are associated with worse prognosis in advanced cancers. Here, using a large-scale retrospective analysis, we show that elevated baseline serum IL-8 levels are associated with poor outcome in patients (n = 1,344) with advanced cancers treated with nivolumab and/or ipilimumab, everolimus or docetaxel in phase 3 clinical trials, revealing the importance of assessing serum IL-8 levels in identifying unfavorable tumor immunobiology and as an independent biomarker in patients receiving immune-checkpoint inhibitors.


Conflict of interest statement

Competing interests

I.M. reports receiving commercial research grants from Bristol-Myers Squibb, Bioncotech, Alligator, AstraZeneca and Roche; has received speakers bureau honoraria from MSD; and is a consultant/advisory board member for Bristol-Myers Squibb, Roche, Genmab, F-Star, Bioncotech, Bayer, Numab, Alligator, Boehringer Ingelheim and AstraZeneca. K.A.S. reports receiving research funding from Genoptix/Navigate (Novartis), Vasculox/Tioma, Tesaro, Moderna Therapeutics, Takeda, Surface Oncology, Pierre-Fabre Research Institute, Merck, Bristol-Myers Squibb, AstraZeneca and Eli Lilly; has received consultant/advisory board fees from Celgene, Moderna Therapeutics, Shattuck Labs, Pierre-Fabre, AbbVie, AstraZeneca, EMD Serono, Ono Pharmaceuticals, Clinica Alemana de Santiago, Dynamo Therapeutics, Torque Therapeutics, Agenus and Takeda; and has received speaker honoraria and/or travel support for meetings from Takeda, Merck, Bristol-Myers Squibb, Fluidigm, Peerview, Biotrac, Cambridge Healthtech Institute, Shattuck Labs and Genentech. J.L.P.-G. reports grants, personal fees and nonfinancial support from Roche, Bristol-Myers Squibb and MSD; and reports grants and personal fees from Ipsen and Eisai, and grants from Incyte and Janssen. M.C., M.Z., S.-P.H., T.C. and Y.F. have a patent (‘Combination Therapy with Anti-IL-8 Antibodies and Anti-PD-1 Antibodies for Treating Cancer’, publication number WO 2019140150). T.P.R. is a co-inventor in a provisional patent application (application number 62/650047) regarding the use of anti-IL-8 and anti-PD1 for the treatment of cancer. M.C., M.Z., T.C., Y.F., S.-P.H., A.M.W, V.B, D.P., T.B., D.L., T.P.R., P.P., J.G. and H.Z. are current or former employees of Bristol-Myers Squibb, which is developing anti-IL-8 (NCT03400332). T.P.R., A.M.W., D.L. and S.-P.H. own stock in Bristol-Myers Squibb. None of the remaining authors have relevant conflicts of interest to report.

Figures

Extended Data Fig. 1 |
Extended Data Fig. 1 |. Statistical identification of a baseline serum IL-8 cutoff below which patients were more likely to benefit from Nivo-based therapy.
ROC curve analyses were used to assess ORR, 6-month PFS, and 12-month OS. OS AUC (12-month) is indicated and identifies ≥23 pg/ml as a cutoff. All cases with nivolumab-containing therapies were analyzed. AUC, area under the curve; Nivo, nivolumab; ORR, objective response rate; OS, overall survival; PFS, progression-free survival; ROC, receiver operator characteristic.
Extended Data Fig. 2 |
Extended Data Fig. 2 |. Association between elevated IL-8 and survival across treatments and tumor types.
Percentage of patients with baseline serum IL-8 levels ≥23 pg/ml across Mel (CheckMate 067: nivolumab, n = 292; ipilimumab, n = 298; nivolumab plus ipilimumab, n = 297), RCC (CheckMate 025, n = 392), sqNSCLC (CheckMate 017, n = 108), and nsqNSCLC (CheckMate 057, n = 255) with nivolumab monotherapy, ipilimumab monotherapy, or nivolumab plus ipilimumab combination therapy, as indicated. PFS and OS hazard ratios (IL-8 ≥ 23 pg/ml versus IL-8 < 23 pg/mL) are also presented (95% CI). HR, hazard ratio; IL, interleukin; Mel, melanoma; nsqNSCLC, nonsquamous non-small cell lung cancer; OS, overall survival; PFS, progression-free survival; RCC, renal cell carcinoma; sqNSCLC, squamous NSCLC.
Extended Data Fig. 3 |
Extended Data Fig. 3 |. Association between elevated IL-8 level and reduced survival was also seen in the non-immunotherapy trial arms.
The specific study, 2-sided log-rank test P values for the survival analysis, the number of independent patients with available IL-8 and OS data (n), and the OS HR (based on Cox proportional hazard model) between IL-8 subgroups (≥23 pg/ml versus <23 pg/ml) are indicated within each chart. a, Probability of OS with <23 pg/ml or ≥23 pg/ml IL-8 levels in patients with RCC treated with everolimus from CheckMate 025 (n = 348). b, Probability of OS with <23 pg/ml or ≥23 pg/ml IL-8 levels in patients with nsqNSCLC treated with docetaxel from CheckMate 057 (n = 253). HR, hazard ratio; IL, interleukin; nsqNSCLC, nonsquamous non-small cell lung cancer; OS, overall survival; RCC, renal cell carcinoma.
Extended Data Fig. 4 |
Extended Data Fig. 4 |. ORR by IL-8 subgroup across trials and treatment arms.
ORR vs baseline serum IL-8 levels <23 pg/ml or ≥23 pg/ml across treatment arms in CheckMate 067 (Mel), CheckMate 025 (RCC), CheckMate 017 (sqNSCLC), and CheckMate 057 (nsqNSCLC). IL, interleukin; Mel, melanoma; nsqNSCLC, nonsquamous non-small cell lung cancer; ORR, objective response rate; RCC, renal cell carcinoma; sqNSCLC, squamous NSCLC. aPatients with complete response or partial response per RECIST v1.1.
Extended Data Fig. 5 |
Extended Data Fig. 5 |. Percentage of patients in each IL-8 subgroup by PD-L1 status (negative or positive) across cohorts.
Percentage of patients with baseline serum IL-8 levels <23 pg/ml or ≥23 pg/ml by PD-L1 status (negative [<1%] or positive [≥1%]) in Mel (CheckMate 067 [PD-L1 < 1%, n = 183; PD-L1 ≥ 1%, n = 673; P = 0.296]) (a), RCC (CheckMate 025 [PD-L1 < 1%, n = 514; PD-L1 ≥ 1%, n = 168; P = 0.884]) (b), sqNSCLC (CheckMate 017 [PD-L1 < 1%, n = 85; PD-L1 ≥ 1%, n = 99; P = 0.263]) (c), and nsqNSCLC (CheckMate 057 [PD-L1 < 1%, n = 181; PD-L1 ≥ 1%, n = 224; P = 0.171]) (d). IL, interleukin; Mel, melanoma; nsqNSCLC, nonsquamous non-small cell lung cancer; PD-L1, programmed death-ligand 1; RCC, renal cell carcinoma; sqNSCLC, squamous NSCLC; P, p-value for chi-squared test of independence between IL-8 subgroup (≥23 pg/ml vs < 23 pg/ml) and PD-L1 status (≥1% vs < 1%).
Extended Data Fig. 6 |
Extended Data Fig. 6 |. Association between IL-8 expression and TMB in human malignancies.
Association between IL-8 mRNA expression and TMB in human Mel (a, n = 324), RCC (b, n = 291), nsqNSCLC (c, n = 427), and sqNSCLC (d, n = 382) from TCGA cohort. The levels of IL-8 transcripts are presented as log10 transformed FPKM units. TMB level was determined as previously reported, including both nonsynonymous and synonymous variants. Dots represent individual samples. Linear regression lines are indicated by purple lines within each chart. IL, interleukin; FPKM, kilobase per million mapped reads; Mel, melanoma; nsqNSCLC, nonsquamous non-small cell lung cancer; RCC, renal cell carcinoma; sqNSCLC, squamous NSCLC; TMB, tumor mutational burden.
Extended Data Fig. 7 |
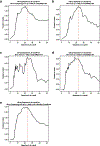
Extended Data Fig. 7 |. Youden’s index by baseline IL-8 cutoff (in pg/ml) from OS ROC curve analyses.
Determination of optimal IL-8 cutoff value for the Nivo-containing arm of CheckMate 067 (n = 589) (a), nivolumab arm of CheckMate 025 (n = 392) (b), nivolumab arm of CheckMate 017 (n = 108) (c), nivolumab arm of CheckMate 057 (n = 255) (d), and all studies pooled (N = 1,344) (e). Red dotted lines indicate 23 pg/ml. IL, interleukin; Nivo, nivolumab; OS, overall survival; ROC, receiver operating characteristic.
Extended Data Fig. 8 |
Extended Data Fig. 8 |. Peripheral blood and tumor samples from 1,344 patients treated with nivolumab or nivolumab plus ipilimumab in 4 phase 3 clinical trials included in the analyses.
Summary of 4 phase 3 clinical trials (CheckMate 067, CheckMate 017, CheckMate 057, CheckMate 025, N = 1,344 patients). IL, interleukin; Mel, melanoma; nsqNSCLC, nonsquamous non-small cell lung cancer; RCC, renal cell carcinoma; sqNSCLC, squamous NSCLC. aIncludes patients who were treated with nivolumab or nivolumab + ipilimumab and had nonmissing serum IL-8 levels.
Extended Data Fig. 9 |
Extended Data Fig. 9 |. Kaplan-Meier analyses to assess overall survival stratified by baseline serum IL-8 levels.
Analysis of pooled data from 1,344 patients receiving nivolumab-based therapy in 4 phase 3 trials—including patients with melanoma, renal cell carcinoma, squamous non-small cell lung cancer, and nonsquamous non-small cell lung cancer—confirmed that elevated baseline serum IL-8 levels were associated with overall survival. This association was significant after adjustment for baseline tumor burden and tumor programmed death-ligand 1 expression (P < 0.001). aOS data from patients in CheckMate trials −017, −057, −067, −025. IL, interleukin.
Fig. 1 |
Fig. 1 |. Association between baseline serum IL-8 level and survival and baseline PD-L1 level in patients treated with immune-checkpoint inhibitors.
af, Exploratory Kaplan–Meier analysis of the OS probability (with 95% confidence intervals) in patients with melanoma (CheckMate 067) (ac; a, nivolumab; b, ipilimumab; c, nivolumab and ipilimumab), RCC (CheckMate 025) (d; nivolumab), sqNSCLC (CheckMate 017) (e; nivolumab) and nsqNSCLC (CheckMate 057) (f; nivolumab) treated with PD-1 and CTLA-4 blockers in four prospective phase 3 clinical trials. Patients were stratified using a serum IL-8 level of 23 pg ml−1. The specific study, two-sided log-rank test P values for the survival analysis, the number of independent patients with available IL-8 and OS data (n) and the OS HR (based on Cox proportional hazard models) between IL-8 subgroups (≥23 pg ml−1 versus <23 pg ml−1) are shown. The dotted lines indicate the 50% probability of OS. gj, The association between the tumor PD-L1 level by IHC analysis and the log2-transformed serum IL-8 level in patients with melanoma (CheckMate 067, n = 856; Spearman’s correlation coefficient, ρ = −0.069) (g), RCC (CheckMate 025, n = 682; ρ = −0.026) (h), sqNSCLC (CheckMate 017, n = 184; ρ = 0.107) (i) and nsqNSCLC (CheckMate 057, n = 405; ρ = 0.081) (j). P values for the two-sided Spearman’s test (based on t-distribution approximation with n − 2 degrees of freedom) of the association between tumor PD-L1 level and the log2-transformed serum IL-8 level, the number of independent patients (n) with paired PD-L1 and serum IL-8 data for each study and Spearman’s correlation coefficients (ρ) are shown. PD-L1 levels were determined using IHC with the DAKO PD-L1 IHC 28–8 pharmDx assay (Agilent), read by a pathologist and expressed as the percentage of positive tumor cells. Baseline serum IL-8 levels were determined by immunoassay and expressed as log2-transformed values of the protein concentration. Each dot indicates an individual patient; the purple line shows the linear regression line (with 95% confidence intervals). There are no multiplicity adjustments made for all statistical analyses.
Fig. 2 |
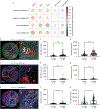
Fig. 2 |. Association between IL-8 levels and monocytes and neutrophils in human malignancies.
a, Association between serum IL-8 levels and tumor mRNA expression of CXCL8, peripheral monocyte counts (Mono), blood neutrophil counts (Neut), IFNγ-related gene signature and the T-cell-related mRNA signature in patients with sqNSCLC (CheckMate 017, n = 113), nsqNSCLC (CheckMate 057, n = 248) or melanoma (Mel; CheckMate 038, n = 142; CheckMate 064, n = 127). The color intensity of the circles indicates the Spearman’s correlation coefficient of the association. Darker red, larger dots represent a greater correlation between serum IL-8 level and the indicated factor; darker blue, larger dots represent a greater negative correlation between serum IL-8 level and the indicated factor. b, Representative fluorescence image of 265 samples from one tumor showing the simultaneous detection of 4′,6-diamidino-2-phenylindole (DAPI; blue), cytokeratin (CK; green), IL-8 (red), CD15 (white) and MPO (magenta) in human NSCLC. c,d, Association between tumor IL-8 protein and MPO (c) or CD15 (d) levels in NSCLC (independent biological samples). e, Representative fluorescence image of 99 samples from one tumor showing the simultaneous detection of DAPI (blue), cytokeratin (green), IL-8 (red), CD15 (white) and MPO (magenta) in human melanoma. f,g, Association between tumor IL-8 protein and MPO (f) or CD15 (g) levels in melanoma (independent biological samples). h, Representative fluorescence image of 307 samples from one tumor showing the simultaneous detection of DAPI (blue), cytokeratin (green), IL-8 (red), CD15 (white) and MPO (magenta) in human RCC. i,j, Association between tumor IL-8 protein and MPO (i) or CD15 (j) levels in RCC (independent biological samples). Patients were stratified using the median score as the cut-off. The number of patients (n) is indicated. P values for the 2-sided Mann–Whitney U-test: *P < 0.0001; ***P = 0.0195; **P = 0.0129; *P = 0.0003. Error bars indicate standard of error of the mean. Scale bars, 100 µm. AU, arbitrary units; QIF, quantitative immunofluorescence.

Comment in

References

    1. Ribas A & Wolchok JD Cancer immunotherapy using checkpoint blockade. Science 359, 1350–1355 (2018). - PMC - PubMed
    1. Havel JJ, Chowell D & Chan TA The evolving landscape of biomarkers for checkpoint inhibitor immunotherapy. Nat. Rev. Cancer 19, 133–150 (2019). - PMC - PubMed
    1. O’Donnell JS, Teng MWL & Smyth MJ Cancer immunoediting and resistance to T cell-based immunotherapy. Nat. Rev. Clin. Oncol 16, 151–167 (2019). - PubMed
    1. Schalper KA, Kaftan E & Herbst RS Predictive biomarkers for PD-1 axis therapies: the hidden treasure or a call for research. Clin. Cancer Res 22, 2102–2104 (2016). - PMC - PubMed
    1. Moore BB et al. Distinct CXC chemokines mediate tumorigenicity of prostate cancer cells. Am. J. Pathol 154, 1503–1512 (1999). - PMC - PubMed

Publication types

MeSH terms