

Environmental Income and Rural Livelihoods: A Global-Comparative Analysis
- PMID: 32405139
- PMCID: PMC7220182
- DOI: 10.1016/j.worlddev.2014.03.006
Environmental Income and Rural Livelihoods: A Global-Comparative Analysis
Abstract
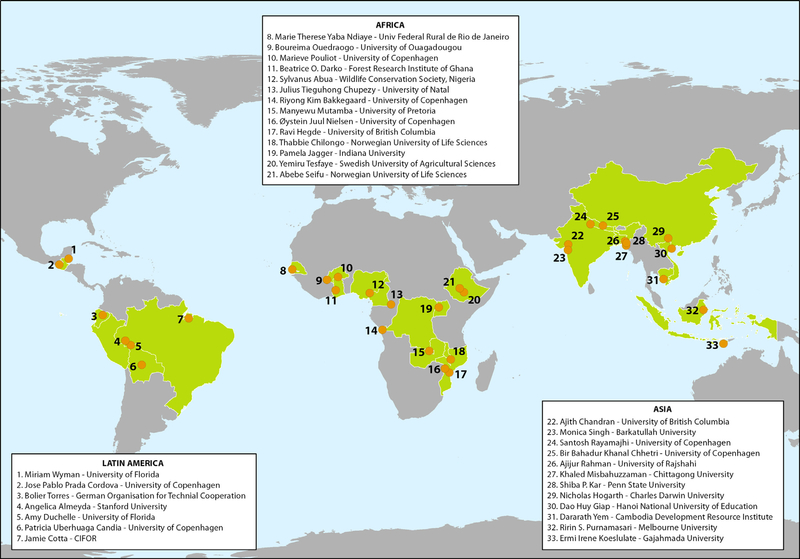
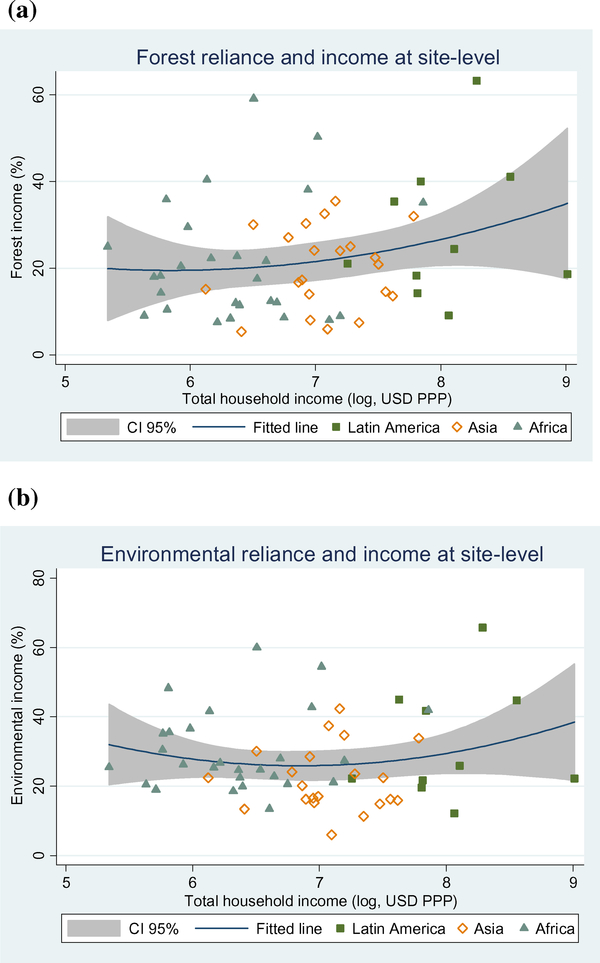
This paper presents results from a comparative analysis of environmental income from approximately 8000 households in 24 developing countries collected by research partners in CIFOR's Poverty Environment Network (PEN). Environmental income accounts for 28% of total household income, 77% of which comes from natural forests. Environmental income shares are higher for low-income households, but differences across income quintiles are less pronounced than previously thought. The poor rely more heavily on subsistence products such as wood fuels and wild foods, and on products harvested from natural areas other than forests. In absolute terms environmental income is approximately five times higher in the highest income quintile, compared to the two lowest quintiles.
Keywords: forests; household income surveys; inequality; poverty.
Figures
References
-
- Adhikari B, Di Falco S, & Lovett JC (2004). Household characteristics and forest dependency: Evidence from common property forest management in Nepal. Ecological Economics, 48(2), 245–257.
-
- Ambrose-Oji B (2003). The contribution of NTFPs to the livelihoods of the ‘forest poor’: Evidence from the tropical forest zone of south-west Cameroon. International Forestry Review, 5(2), 106–117.
-
- Angelsen A, & Wunder S (2003). Exploring the forest-poverty link: Key concepts, issues and research implications. CIFOR Occasional Paper No. 40. Bogor, Indonesia: Center for International Forestry Research.
-
- Angelsen A, Larsen HO, Lund JF, Smith-Hall C, & Wunder S (Eds.) (2011). Measuring livelihoods and environmental dependence: Methods for research and fieldwork. London: Earthscan.
-
- Appiah M, Blay D, Damnyag L, Dwomoh FK, Pappinen A, & Luukkanen O (2009). Dependence on forest resources and tropical deforestation in Ghana. Environment, Development and Sustainability, 11(3), 471–487.
Grants and funding
LinkOut - more resources
Full Text Sources