. 2020 May 5;11(18):1576-1589.
doi: 10.18632/oncotarget.27516.

The anti-tumor activity of pralatrexate (PDX) correlates with the expression of RFC and DHFR mRNA in preclinical models of multiple myeloma

Affiliations

The anti-tumor activity of pralatrexate (PDX) correlates with the expression of RFC and DHFR mRNA in preclinical models of multiple myeloma

Cristina Kinahan et al. Oncotarget. .

Abstract

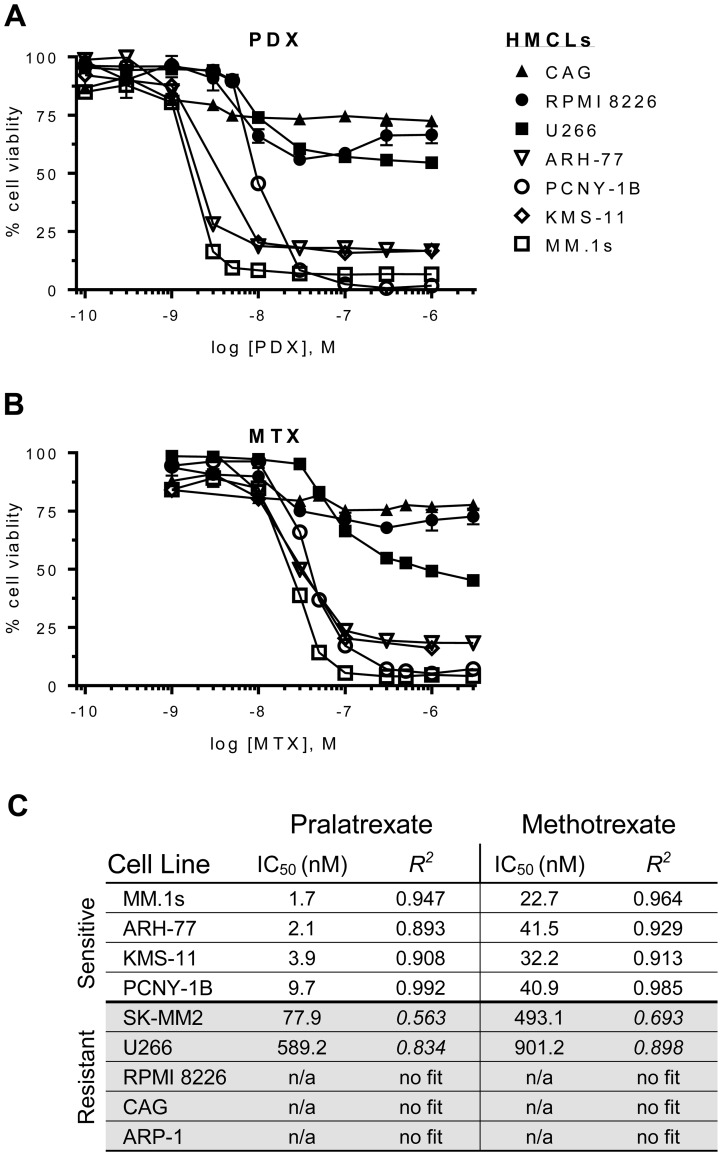
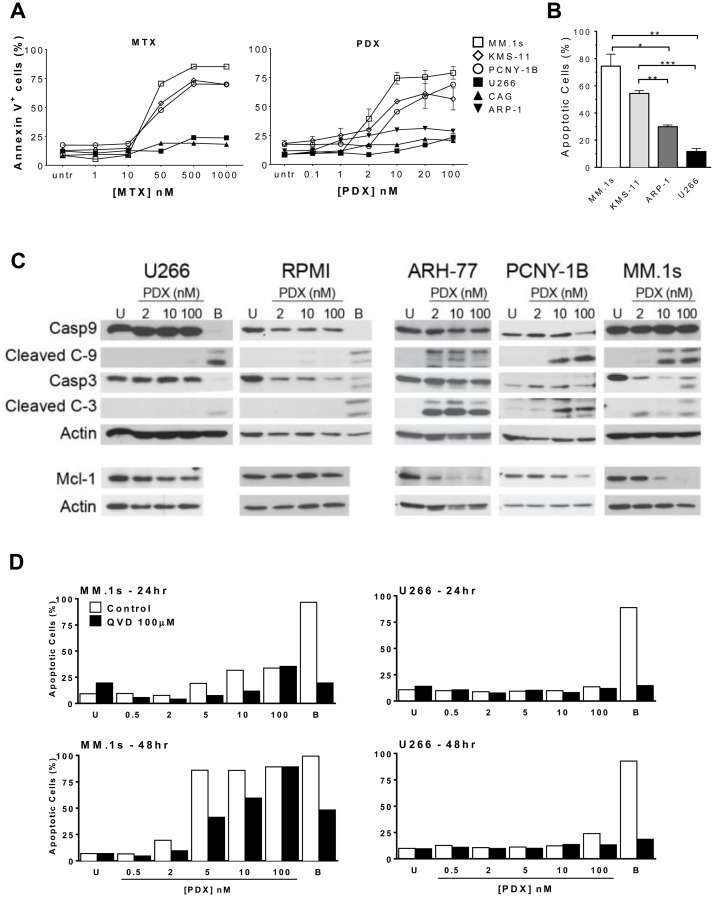
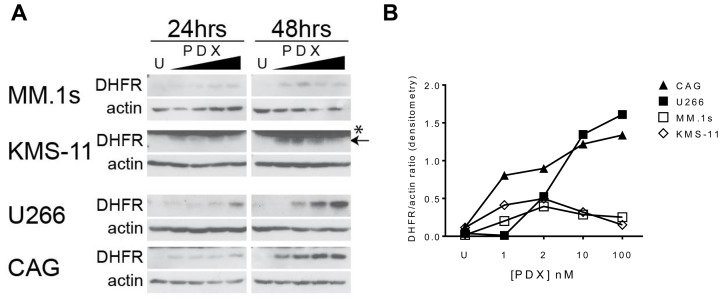
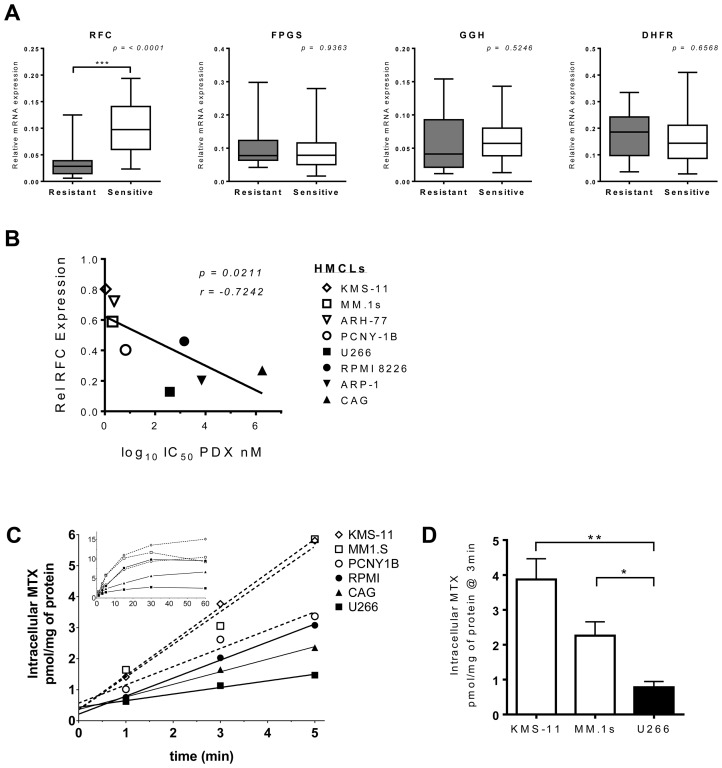
Multiple myeloma (MM) is the second most common hematologic malignancy. While major advances have been made in the disease, it is still incurable. Although antifolate-based drugs are not commonly used to treat myeloma, new generation analogs with distinct patterns of preclinical and clinical activity may offer an opportunity to identify new classes of potentially active drugs. Pralatrexate (PDX), which was approved for the treatment of relapsed or refractory peripheral T-cell lymphoma in 2009, may be one such drug. Pralatrexate exhibits a potency and pattern of activity distinct from its predecessors like methotrexate (MTX). We sought to understand the activity and mechanisms of resistance of multiple myeloma to these drugs, which could also offer potential strategies for selective use of the drug. We demonstrate that PDX and MTX both induce a significant decrease in cell viability in the low nanomolar range, with PDX exhibiting a more potent effect. We identified a series of myeloma cell lines exhibiting markedly different patterns of sensitivity to the drugs, with some lines frankly resistant, and others exquisitely sensitive. These differences were largely attributed to the basal RFC (Reduced Folate Carrier) mRNA expression levels. RFC mRNA expression correlated directly with rates of drug uptake, with the most sensitive lines exhibiting the most significant intracellular accumulation of pralatrexate. This mechanism explains the widely varying patterns of sensitivity and resistance to pralatrexate in multiple myeloma cell lines. These findings could have implications for this class of drugs and their role in the treatment of multiple myeloma.

Keywords: antifolate; biomarker; multiple myeloma; pralatrexate; reduced folate carrier (RFC).


Conflict of interest statement

CONFLICTS OF INTEREST OAO receives research support from Spectrum Pharmaceuticals. HJC is an employee of the Multiple Myeloma Research Foundation, received commercial research support from Agenus Inc. and Genentech Roche, and compensation for consulting/advisory boards from Genentech Roche, Celgene, Bristol- Myers Squibb, and GlaxoSmithKline. All other authors declare no conflicts of interests.

Figures

Figure 1
Figure 1. Dose-response curves for antifolates in a panel of HMCLs.
Human multiple myeloma cell lines (HMCLs) were incubated with increasing concentrations of (A) pralatrexate (PDX) or (B) methotrexate (MTX) for 48 hrs. The HMCLs segregated into sensitive (open icons: ARH-77, MM.1s, KMS-11, PCNY-1B) or resistant (filled icons: U266, CAG, RPMI 8226) groupings. (C) An ordered list of half maximal inhibitory concentration (IC50) values for PDX and MTX in HMCLs. The values were determined using an ordinary least squares nonlinear curve fitting method and the goodness of fit was determined valid with an R2 > 0. The curves were normalized to untreated cells (100%) and bortezomib (10–50 nM) treated cells (0%). Data represent the mean ± SD of at least three experiments. Cell viability was determined by an ATP-dependent luciferase-based reporter assay.
Figure 2
Figure 2. Antifolates induce apoptosis in a dose-dependent manner in sensitive HMCLs.
(A) Sensitive HMCLs - MM.1s (open square), KMS-11 (open diamond), PCNY-1B (open circle) and resistant HMCLs – U266 (filled square), CAG (filled triangle), ARP-1 (filled inverted triangle) were incubated with increasing concentrations of either MTX or PDX for 48 hrs. Apoptosis was determined by flow cytometry using a fluorochrome-conjugated-AnnexinV marker. Untreated cells (untr) served as a negative control and bortezomib (10–50 nM) treated cells (not shown) served as a positive control for apoptotic cell death. (B) Sensitive HMCLs, MM.1s (white) and KMS-11 (light gray), exhibit more apoptosis than resistant HMCLs, ARP-1 (dark gray) and U266 (black), after 48 hrs of exposure to 10 nM PDX. The statistical analysis uses data from three separate experiments. Paired student t-test generated p values: * p < 0.02, ** p < 0.005, *** p < 0.001. (C) Western blot analysis depicting relative protein levels of full length and cleaved caspase 9, caspase 3, full length Mcl-1, and β-actin. HMCLs (U266, RPMI 8226, ARH-77, PCNY-1B, and MM.1s) were treated with 2, 10 or 100 nM PDX for 48 hrs. Artifact observed in U266 10 nM PDX treated Actin sample. When the X-ray film is pulled out it can cause scratches to appear on the film, causing such artifacts. (D) MM.1s (left panels) and U266 (right) were incubated with increasing amounts of PDX (0.5 nM – 100 nM) in the presence (black bars) or absence (white) of 100 μM of pancaspase inhibitor Q-VD-OPh (QVD). Data were collected at 24hrs (top panels) and 48hrs (bottom) of incubation. U = vehicle control cells, B = bortezomib treated cells (10 nM).
Figure 3
Figure 3. Antifolates cause cell-cycle disruption in MM.1s myeloma tumor cells.
MM.1s cells were incubated with either PDX (1 nM, 3 nM, 10 nM) or MTX (10 nM, 30 nM 100 nM) for 24 hrs. Time points were taken at 6, 12 and 24 hrs. Thirty minutes prior to isolation at each time point MM.1s cells were pulsed with Bromodeoxyuridine (BrdU). (A) A flow cytometry dot plot array shows 7AAD/αBrdU co-stained MM.1s cells at 6 hrs, 12 hrs, and 24 hrs at single dose - PDX (3 nM) and MTX (30 nM). The gates define cells in the three stages of the cell cycle: G1, S-phase (S), and G2/mitosis (G2). (B) A graphical representation of the entire experimental data set. Drug concentrations listed on the x-axis are in nM.
Figure 4
Figure 4. HMCLs retain sensitivity to PDX in the presence of microenvironment prosurvival factors.
(A) A subset of HMCLs were cultured in the presence of IL-6 (5 ng/ml) for 24 hrs prior to incubation with increasing concentrations of PDX (0.3 nM–100 nM). Cell viability was assayed after 48 hrs of PDX exposure. The curves are normalized to untreated cells (100%) and bortezomib (10–50 nM) treated cells (0%). Data represent the mean ± SD of at least three experiments. (B) KMS-11, MM.1s and U266 cells were cultured for 24 hrs with or without IL-6 (5 ng/ml) and whole cells lysates were analyzed by western blot for phospho-STAT3 Tyr705 (pSTAT3), total STAT3 (STAT3). β-actin served as a loading control. (C) MM.1s and U266 cells were incubated on a monolayer of HS-5 bone marrow stroma-derived cells (BMSC) and incubated with increasing concentrations of PDX (MM.1s: 1 nM, 2 nM, 100 nM; U266: 2 nM, 10 nM, 100 nM). Dual color flow cytometry plots depicting apoptotic (annexin V+) MM.1s (CD38+) cells at 24 hrs and 48 hrs. (D) The full data set of the apoptotic HMCL population depicting MM.1s cells (AnnexinV+ CD38+) alone (white), U266 cells (AnnexinV+ CD138+) alone (gray) and HS-5: HMCL co-culture respectively (black). Untr = untreated vehicle control cells.
Figure 5
Figure 5. Antifolate-resistance in HMCLs correlates to the magnitude of DHFR protein upregulation in response to PDX.
(A) PDX-sensitive cells MM.1s, KMS-11 and PDX-resistant cells U266, CAG were incubated with increasing concentrations of PDX (1, 2, 10, 100 nM) for 24 and 48 hrs. Whole cell lysates were run on a SDS-PAGE gel and protein expression analyzed by western blot. (B) The semi-quantitative densitometry data for the relative expression levels of DHFR (ratio of DHFR band intensity/beta-actin band intensity) for 48 hr samples in panel A. U = untreated cells, * denotes a non-specific band at 25 kDa in the KMS-11 & ARH-77 cell lines, proper band is below (arrow).
Figure 6
Figure 6. RFC expression and function correlate with PDX-sensitivity in HMCLs.
(A) Relative mRNA expression of folate pathway genes in PDX-senstive (white) and PDX-resistant (black) HMCLs. The gene transcripts analyzed by RT-qPCR analysis were RFC, FPGS, GGH and DHFR. Eight cell lines made up the panel of HMCLs, four resistant: CAG, U266, ARP-1, RPMI 8226 and four sensitive: PCNY-1B, ARH-77, KMS-11 and MM.1s. Messenger RNA levels from each respective gene transcript were normalized to beta-actin and cyclophilin B. The data represent a minimum of three individual experiments. The box whisker plot demarcations: mean (line), box (25th-75th percentile), whiskers (minimium and maximium). The two-tailed p values were obtained through an unpaired Student t-test. (B) Correlation between RFC mRNA expression levels in 8 HMCL lines (open symbols = PDX-sensitive, filled symbols = PDX-resistant) and their respective IC50 values for PDX. The p value is one-tailed, r value = Pearson correlation coefficient. (C) The net uptake kinetics of MTX in a panel of resistant (black, solid line) and sensitive (open, dashed line) HMCLs. Cells were exposed to 1 μM MTX spiked with [3H-MTX] and samples were taken at 1, 2, 3, 5, 15, 30 and 60 min after the initial exposure. The main chart displays linear data obtained from 0-5 mins; the inset shows all data points 0–60 mins. Data are from a single experiment, which is representative of repeat studies. (D) Data compiled from a set of experiments comparing intracellular MTX level differences at 3 minutes after 3H-MTX incubation in KMS-11, MM.1s and U266 cells. The p-value was calculated by multiple t-test analysis and significance determined using the Holm-Sidak method (alpha = 5.0%) * p < 0.05, ** p < 0.005.

References

    1. Laubach J, Garderet L, Mahindra A, Gahrton G, Caers J, Sezer O, Voorhees P, Leleu X, Johnsen HE, Streetly M, Jurczyszyn A, Ludwig H, Mellqvist UH, et al. . Management of relapsed multiple myeloma: recommendations of the International Myeloma Working Group. Leukemia. 2016; 30:1005–17. 10.1038/leu.2015.356. - DOI - PubMed
    1. Egan JB, Shi CX, Tembe W, Christoforides A, Kurdoglu A, Sinari S, Middha S, Asmann Y, Schmidt J, Braggio E, Keats JJ, Fonseca R, Bergsagel PL, et al. . Whole-genome sequencing of multiple myeloma from diagnosis to plasma cell leukemia reveals genomic initiating events, evolution, and clonal tides. Blood. 2012; 120:1060–66. 10.1182/blood-2012-01-405977. - DOI - PMC - PubMed
    1. Bolli N, Avet-Loiseau H, Wedge DC, Van Loo P, Alexandrov LB, Martincorena I, Dawson KJ, Iorio F, Nik-Zainal S, Bignell GR, Hinton JW, Li Y, Tubio JM, et al. . Heterogeneity of genomic evolution and mutational profiles in multiple myeloma. Nat Commun. 2014; 5:2997. 10.1038/ncomms3997. - DOI - PMC - PubMed
    1. Corre J, Munshi N, Avet-Loiseau H. Genetics of multiple myeloma: another heterogeneity level? Blood. 2015; 125:1870–76. 10.1182/blood-2014-10-567370. - DOI - PMC - PubMed
    1. Mitsiades CS, Davies FE, Laubach JP, Joshua D, San Miguel J, Anderson KC, Richardson PG. Future directions of next-generation novel therapies, combination approaches, and the development of personalized medicine in myeloma. J Clin Oncol. 2011; 29:1916–23. 10.1200/JCO.2010.34.0760. - DOI - PubMed

LinkOut - more resources