. 2020 May 7;5(3):624-635.
doi: 10.1016/j.bioactmat.2020.04.011. eCollection 2020 Sep.

High-affinity mutant Interleukin-13 targeted CAR T cells enhance delivery of clickable biodegradable fluorescent nanoparticles to glioblastoma

Affiliations

High-affinity mutant Interleukin-13 targeted CAR T cells enhance delivery of clickable biodegradable fluorescent nanoparticles to glioblastoma

Gloria B Kim et al. Bioact Mater. .

Abstract

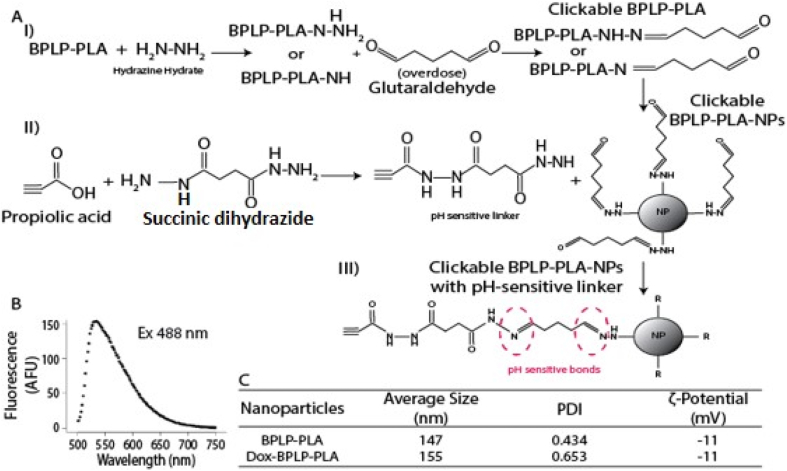
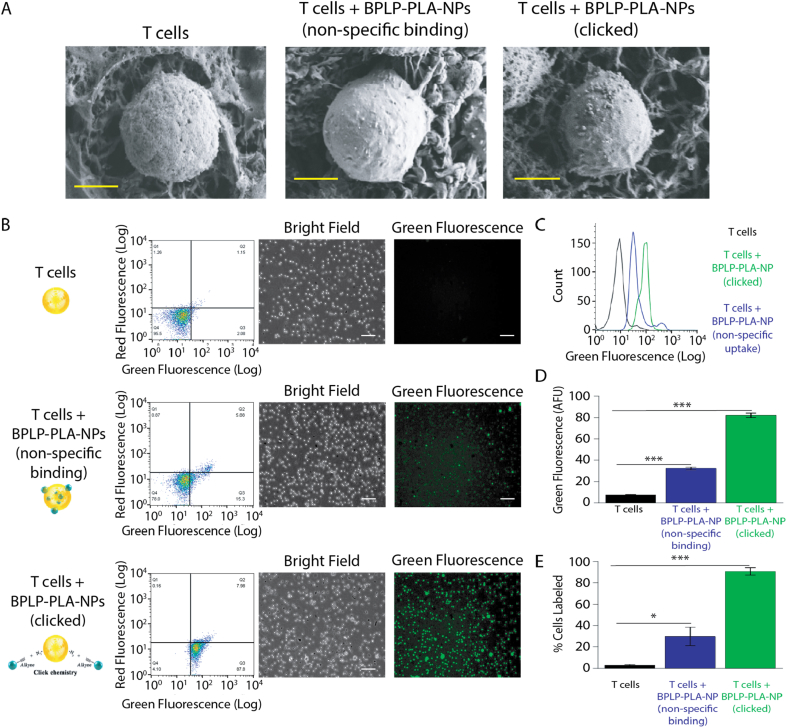
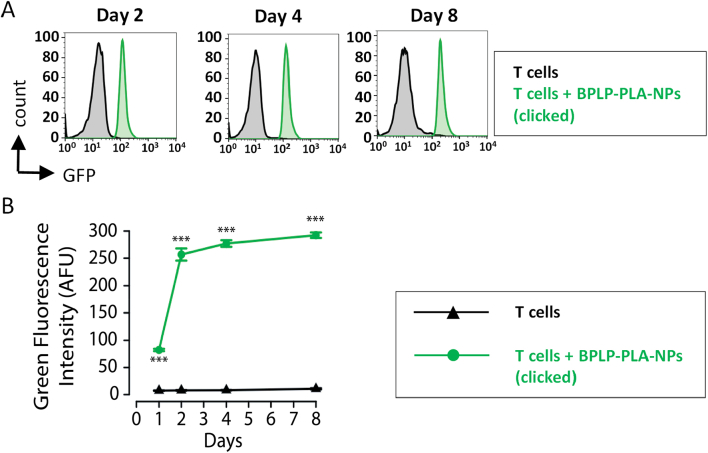
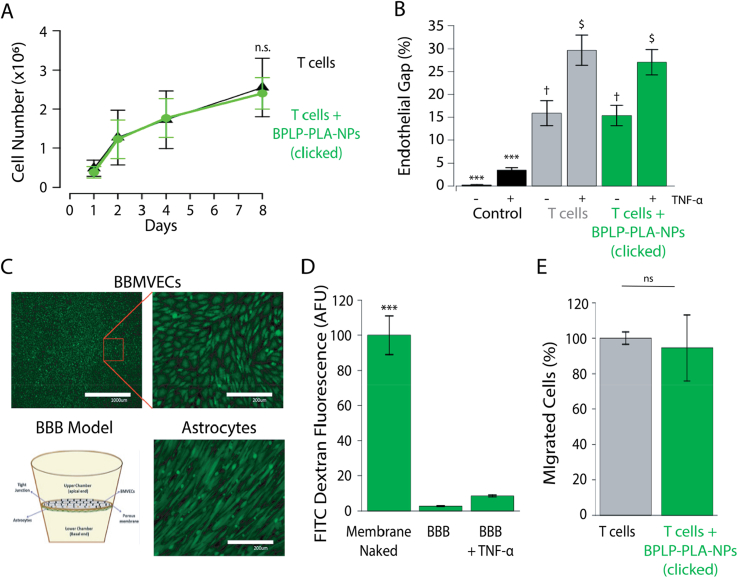
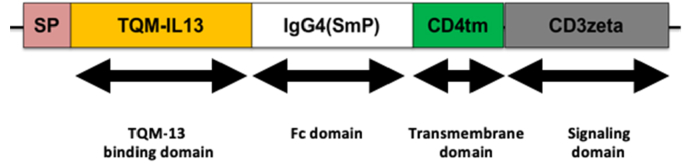
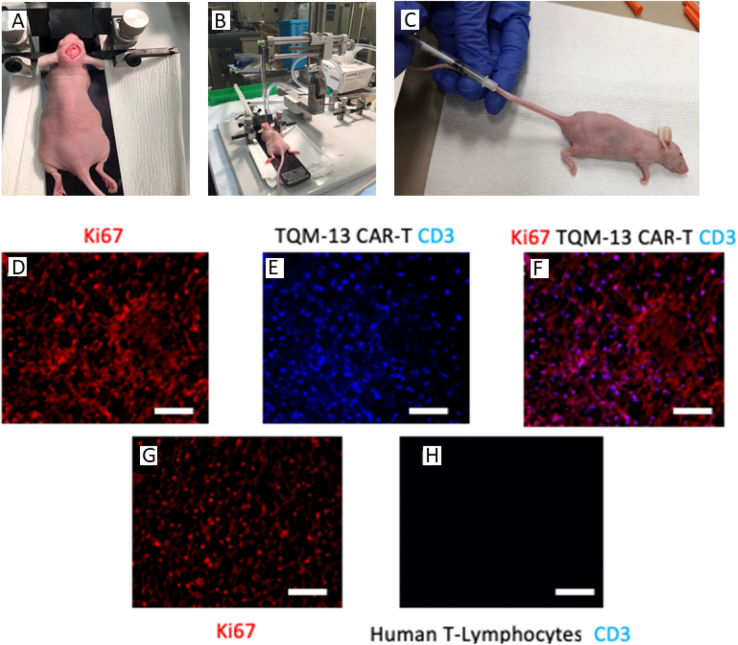
Glioblastoma (GBM), the deadliest form of brain cancer, presents long-standing problems due to its localization. Chimeric antigen receptor (CAR) T cell immunotherapy has emerged as a powerful strategy to treat cancer. IL-13-receptor-α2 (IL13Rα2), present in over 75% of GBMs, has been recognized as an attractive candidate for anti-glioblastoma therapy. Here, we propose a novel multidisciplinary approach to target brain tumors using a combination of fluorescent, therapeutic nanoparticles and CAR T cells modified with a targeted-quadruple-mutant of IL13 (TQM-13) shown to have high binding affinity to IL13Rα2-expressing glioblastoma cells with low off-target toxicity. Azide-alkyne cycloaddition conjugation of nanoparticles to the surface of T cells allowed a facile, selective, and high-yielding clicking of the nanoparticles. Nanoparticles clicked onto T cells were retained for at least 8 days showing that the linkage is stable and promising a suitable time window for in vivo delivery. T cells clicked with doxorubicin-loaded nanoparticles showed a higher cytotoxic effect in vitro compared to bare T cells. In vitro and in vivo T cells expressing TQM-13 served as delivery shuttles for nanoparticles and significantly increased the number of nanoparticles reaching brain tumors compared to nanoparticles alone. This work represents a new platform to allow the delivery of therapeutic nanoparticles and T cells to solid tumors.

Keywords: Citrate polymers; Fluorescence; Glioblastoma; Nanoparticles; T cells; Targeted drug delivery.


Conflict of interest statement

Dr. Yang and The Pennsylvania State University have a financial interest in Acuitive Technologies, Inc. and Aleo BME, Inc. These interests have been reviewed by the University's Institutional and Individual Conflict of Interest Committees and are currently being managed by the University.

Figures

Image 1
Graphical abstract
Fig. 1
Fig. 1
Fabrication and characterization of BPLP-PLA-NPs. (A) Schematic illustration of (I) clickable BPLP-PLA synthesis, (II) clickable pH-sensitive linkers, and (III) fabrication of BPLP-PLA-NPs with pH-sensitive linkers. (B) Emission fluorescence spectra of BPLP-PLA-NP using a 488 nm excitation wavelength. (C) Average size, polydispersity index and zeta-potential of BPLP-PLA-NPs and Dox-BPLP-PLA-NPs measured by DLS.
Fig. 2
Fig. 2
Clicking of BPLP-PLA-NPs onto T cells. (A) SEM micrographs of T cells, T cells + BPLP-PLA-NPs (non-specific binding) and T cells + BPLP-PLA-NPs (clicked). Scale bar represents 1 μm. (B) Flow cytometry data and fluorescent micrographs of T cells, T cells + BPLP-PLA-NPs (non-specific binding) and T cells + BPLP-PLA-NPs (clicked), scale bar represents 50 μm. (C) Green fluorescence histograms of the three groups in panel B. (D) Green fluorescence intensity quantification of the three groups in panel B. Results represent the mean ± SEM (***p < 0.001 in comparison to T cells alone, n = 3 for all groups). (E) Percentage of cells labeled with NPs of the three groups in panel B. (***p < 0.001, *p < 0.05 in comparison to T cells alone, n = 3 for all groups).
Fig. 3
Fig. 3
Stability and fluorescence characterization of BPLP-PLA-NPs clicked T Cells. (A) Flow cytometry analysis of a time-course monitoring on the fluorescence of T cells and T cells + BPLP-PLA-NPs (clicked). (B) Green fluorescence intensity quantification of T cells and T cells + BPLP-PLA-NPs (clicked). Results represent the mean ± SEM (***p < 0.001 in comparison to T cells alone at equal times, n = 3 for all groups).
Fig. 4
Fig. 4
Normal physiological functions of immune cells are not altered following clicking of BPLP-PLA-NPs. (A) Proliferation of T cells and T cells + BPLP-PLA-NPs (clicked) over 8 days. Results represent the mean ± SEM (ns - no significant difference, n = 4 for both groups). (B) Gap formation by T cells and T cells + BPLP-PLA-NPs (clicked) on monolayers of BBMVECs. Results represent the mean ± SEM (***, , $ p < 0.001 in comparison to control group, no significant difference between groups with same symbols, n = 3 for all groups). (C) Fluorescent micrographs, cartoon of the BBB model in vitro. Scale bar represents 1000 μm on the left image and 200 μm on the right images. (D) Quantification of diffusion of FITC-Dextran MW 40 kDa across the BBB model. Results represent the mean ± SEM (***p < 0.001 in comparison to membrane naked, n = 3 for all groups). (E) Quantification of T cells and T cells + BPLP-PLA-NPs (clicked) that migrated in vitro in response to CXCL-12 (bottom). Results represent the mean ± SEM (ns - not statistically significant difference, n = 3 for both groups).
Fig. 5
Fig. 5
Cytotoxic effect of Dox-BPLP-PLA-NPs clicked onto T cells. (A) Viability of U87Luc cells after 48 h treatment with free doxorubicin, BPLP-PLA-NPs alone or Dox-BPLP-PLA-NPs alone. Results represent the mean ± SEM. Statistical analysis shows significant difference with respect to control group (***p < 0.001, n.s – no significant difference between groups, n = 3 for all groups). (B) Viability of U87Luc cells after 48 h treatment with media alone (control), T cells alone or T cells + Dox-BPLP-PLA-NPs (clicked). Results represent the mean ± SEM. Statistical analysis shows significant difference with respect to T cells alone (**p < 0.01, n.s - no significant difference between groups, n = 3 for all groups).
Fig. 6
Fig. 6
Schematic for TQM-IL13 CAR. It includes a signal peptide (SP), TQM-13 as an extracellular domain (TQM-IL13), an Fc domain [IgG4 (SmP)], a transmembrane domain (CD4tm), and an intracellular signal transduction domain CD3-ζ.
Fig. 7
Fig. 7
TQM-13 CAR-T cells infiltrate mouse intracranial tumors. (A) Shows the stereotaxic setup in which the mouse is placed for the surgical procedure of preparing intracranial model. (B) Shows the setup in which U87Luc cells are intracranially injected. (C) Shows a nude mouse tail-injected with TQM-13 CAR-T cells. (DH) These are a series of representative images from the mouse intracranial tumor model using u87 cells to establish the tumor. (D) Demonstrates establishment of a proliferative tumor within the brain with staining for Ki67. (E) Demonstrates the presence of human T cells (detected with CD3) in the tumor 24 h after injection. (F) Overlay from A and B demonstrates that TQM-13 CAR-T human T cells are found within the tumor. (GH) Show slices from a tumor bearing mouse that received untransduced T cells. (G) Demonstrates establishment of a proliferative tumor within the brain with staining with Ki67. (H) Shows that untransduced human T cells are not detected in the tumor 24 h after injection. Scale bars represent 70 μm.
Fig. 8
Fig. 8
TQM-13 CAR-T modified cells clicked with BPLP-PLA NPs infiltrate tumor tissue in the murine intracranial model. (A) Demonstrates establishment of a proliferative tumor within the brain with KI67 staining. (B) Indicates the presence of fluorescently labeled BPLP-PLA NP in the tumor after intravenous injection of TQM-13 CAR-T clicked with BPLP-PLA NP cells. This figure takes advantage of the inherent fluorescence of the NPs (green). (C) Demonstrates the presence of TQM-13 CAR-T human T cells in the tumor. (D) Overlay from B and C demonstrates that TQM-13 CAR-T cells clicked with BPLP are associated with the human T cells. (E) Affirms that BPLP-PLA NP clicked to TQM-13 CAR-T cells were delivered to the intracranial tumor (overlay includes the presence of Ki67 staining). (F) Demonstrates that there are no detectable NPs in the tumor when the NPs are injected without clicking to the T cells. Scale bars represent 70 μm.

References

    1. Jain R.K., Di Tomaso E., Duda D.G., Loeffler J.S., Sorensen A.G., Batchelor T.T. Angiogenesis in brain tumours. Nat. Rev. Neurosci. 2007;8(8):610–622. - PubMed
    1. Delgado-Lopez P.D., Corrales-Garcia E.M. Survival in glioblastoma: a review on the impact of treatment modalities. Clin. Transl. Oncol. 2016;18(11):1062–1071. - PubMed
    1. Mrugala M.M. Advances and challenges in the treatment of glioblastoma: a clinician's perspective. Discov. Med. 2013 - PubMed
    1. Orringer D. Extent of resection in patients with glioblastoma: limiting factors, perception of resectability, and effect on survival. J. Neurosurg. 2012;117(5):851–859. - PubMed
    1. Klein E., Becker S., Svedmyr E., Jondal M., Vanky F. Tumor infiltrating lymphocytes. Ann. N. Y. Acad. Sci. 1976;276(1):207–216. - PubMed