Does vision extract absolute distance from vergence?
- PMID: 32406005
- PMCID: PMC7381460
- DOI: 10.3758/s13414-020-02006-1
Does vision extract absolute distance from vergence?
Abstract
Since Kepler (1604) and Descartes (1637), 'vergence' (the angular rotation of the eyes) has been thought of as one of our most important absolute distance cues. But vergence has never been tested as an absolute distance cue divorced from obvious confounding cues such as binocular disparity. In this article, we control for these confounding cues for the first time by gradually manipulating vergence and find that observers fail to accurately judge distance from vergence. We consider several different interpretations of these results and argue that the most principled response to these results is to question the general effectiveness of vergence as an absolute distance cue. Given that other absolute distance cues (such as motion parallax and vertical disparities) are limited in application, this poses a real challenge to our contemporary understanding of visual scale.
Keywords: 3D vision; Accommodation; Distance perception; Vergence; Visual scale.
Figures


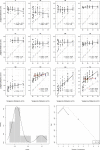
 = – 4.15D,
  = – 3.15D, and
  = – 2.15D). Bottom panels: Results best fit with two populations with equal variance (△E), with Gaussian mixture model plotted on histogram of the slopes

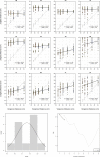
 = – 4.15D,
  = – 3.15D, and
  = – 2.15D). Bottom panels Results best fit with a single population, with Gaussian mixture model plotted on histogram of the slopes
Similar articles
-
Depth constancy and the absolute vergence anomaly.Vision Res. 2025 Jan;226:108501. doi: 10.1016/j.visres.2024.108501. Epub 2024 Nov 2. Vision Res. 2025. PMID: 39488862
-
Influence of proximal, accommodative and disparity stimuli upon the vergence system.Ophthalmic Physiol Opt. 1993 Jul;13(3):239-43. doi: 10.1111/j.1475-1313.1993.tb00465.x. Ophthalmic Physiol Opt. 1993. PMID: 8265164
-
Depth perception in random dot stereograms is not affected by changes in either vergence or accommodation.Optom Vis Sci. 1998 Oct;75(10):743-7. doi: 10.1097/00006324-199810000-00019. Optom Vis Sci. 1998. PMID: 9798214
-
Neuromuscular plasticity and rehabilitation of the ocular near response.Optom Vis Sci. 2009 Jul;86(7):E788-802. doi: 10.1097/OPX.0b013e3181ae00a5. Optom Vis Sci. 2009. PMID: 19543139 Review.
-
Minimal theory of 3D vision: new approach to visual scale and visual shape.Philos Trans R Soc Lond B Biol Sci. 2023 Jan 30;378(1869):20210455. doi: 10.1098/rstb.2021.0455. Epub 2022 Dec 13. Philos Trans R Soc Lond B Biol Sci. 2023. PMID: 36511406 Free PMC article. Review.
Cited by
-
A comparative study of stereopsis measurements: analyzing natural conditions versus dichoptic presentation using smartphones and ultraviolet printer technology.PeerJ. 2024 Feb 12;12:e16941. doi: 10.7717/peerj.16941. eCollection 2024. PeerJ. 2024. PMID: 38361768 Free PMC article.
-
V1 as an egocentric cognitive map.Neurosci Conscious. 2021 Sep 14;2021(2):niab017. doi: 10.1093/nc/niab017. eCollection 2021. Neurosci Conscious. 2021. PMID: 34532068 Free PMC article.
-
Stereoscopic depth constancy for physical objects and their virtual counterparts.J Vis. 2022 Mar 2;22(4):9. doi: 10.1167/jov.22.4.9. J Vis. 2022. PMID: 35315875 Free PMC article.
-
When virtual and real worlds coexist: Visualization and visual system affect spatial performance in augmented reality.J Vis. 2021 Aug 2;21(8):17. doi: 10.1167/jov.21.8.17. J Vis. 2021. PMID: 34388233 Free PMC article.
-
Coding of egocentric distance in the macaque ventral intraparietal area.iScience. 2025 Feb 10;28(3):111993. doi: 10.1016/j.isci.2025.111993. eCollection 2025 Mar 21. iScience. 2025. PMID: 40060902 Free PMC article.
References
-
- Abbott, A. L., & Ahuja, N. (1988). Surface Reconstruction By Dynamic Integration Of Focus, Camera Vergence, And Stereo. [1988 Proceedings] Second International Conference on Computer Vision, 532–543. 10.1109/CCV.1988.590034
-
- Abbott, A. L., & Ahuja, N. (1990). Active surface reconstruction by integrating focus, vergence, stereo, and camera calibration. [1990] Proceedings Third International Conference on Computer Vision, 489–492. 10.1109/ICCV.1990.139576
-
- Auvray M, O’Regan J. L’influence des facteurs sémantiques sur la cécité aux changements progressifs dans les scènes visuelles. L’Année psychologique. 2003;103(1):9–32. doi: 10.3406/psy.2003.29621. - DOI
-
- Baird JW. The Influence of Accommodation and Convergence upon the Perception of Depth. The American Journal of Psychology. 1903;14(2):150–200. doi: 10.2307/1412712. - DOI
MeSH terms
LinkOut - more resources
Full Text Sources

