

Various skin impedance models based on physiological stratification
- PMID: 32406379
- PMCID: PMC8687402
- DOI: 10.1049/iet-syb.2019.0013
Various skin impedance models based on physiological stratification
Abstract
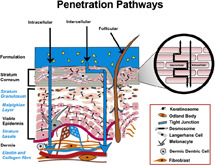
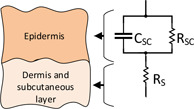
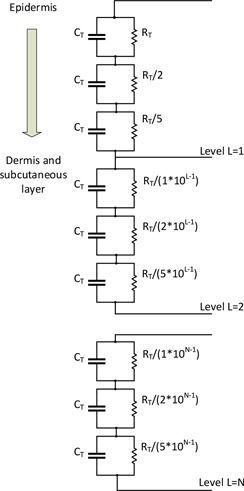
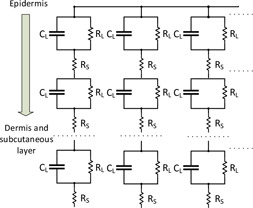
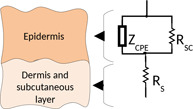
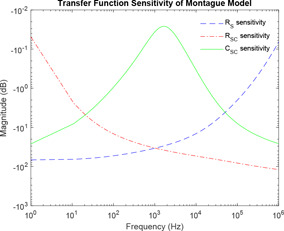
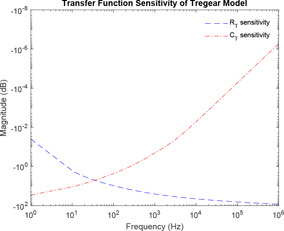
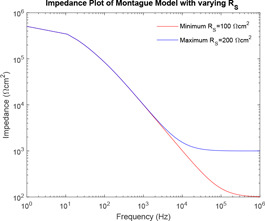
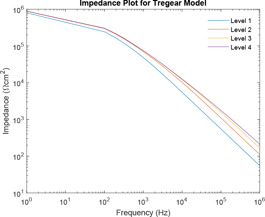
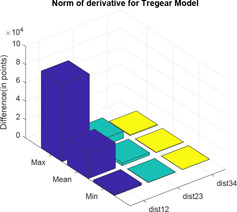
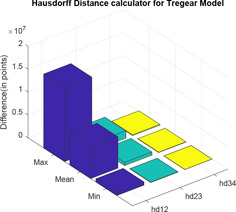
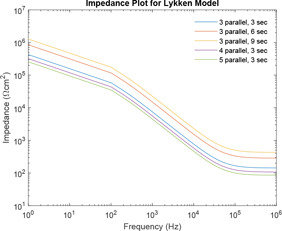
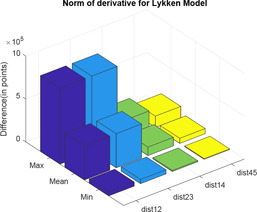
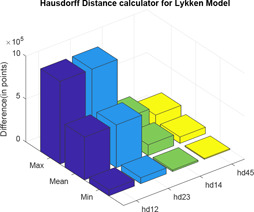
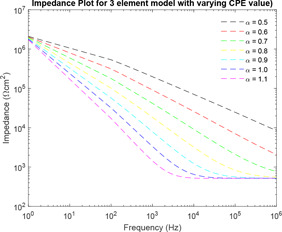
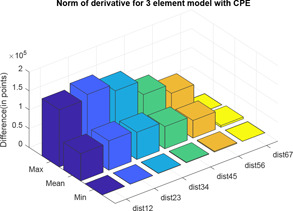
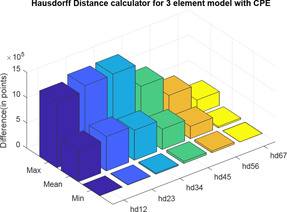
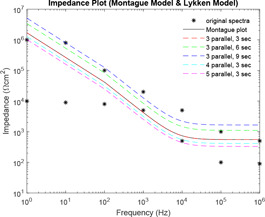
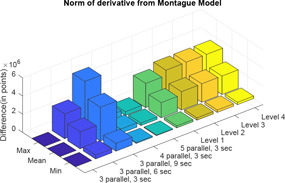
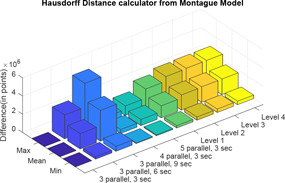
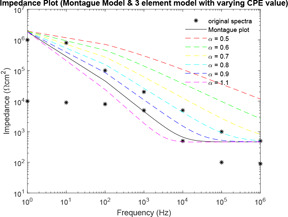
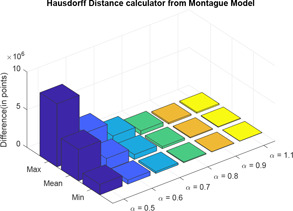
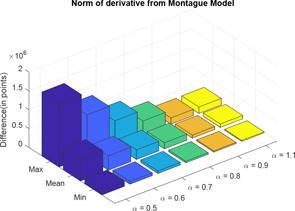
Transdermal drug delivery is a non-invasive method of drug administration. However, to achieve this, the drug has to pass through the complicated structure of the skin. The complex structure of skin can be modelled by an electrical equivalent circuit to calculate its impedance. In this work, the transfer function of three electrical models of the human skin (Montague, Tregear and Lykken Model) based on physiological stratification are analysed. Sensitivity analysis of these models is carried out to consider the extent to which changes in system parameters (different types of R and C as described by different models) affect the behaviour of the model. Techniques like normal of derivative and Hausdorff Distance is also used to study and understand the different curves. Comparison is also made with CPE based model. As Montague Model is the most widely used model, Tregear and Lykken Model are compared with it. It can be commented that out of the above observations Tregear Model at Level 3 can be used for establishing the electrical equivalent of human skin due to its simplicity. However, fractional ordered CPE models provide a good approximation. Future prospect lies in developing a model that characterize both biological properties and physiological stratification.
Figures
Similar articles
-
Estimation of skin impedance models with experimental data and a proposed model for human skin impedance.IET Syst Biol. 2020 Oct;14(5):230-240. doi: 10.1049/iet-syb.2020.0049. IET Syst Biol. 2020. PMID: 33095744 Free PMC article.
-
Numerical simulation of iontophoresis for in-silico prediction of transdermal drugs in the dermal layers using skin impedance values.Comput Methods Programs Biomed. 2022 Feb;214:106551. doi: 10.1016/j.cmpb.2021.106551. Epub 2021 Nov 24. Comput Methods Programs Biomed. 2022. PMID: 34864336
-
In vivo ac impedance spectroscopy of human skin. Theory and problems in monitoring of passive percutaneous drug delivery.Ann N Y Acad Sci. 1999 Apr 20;873:197-213. doi: 10.1111/j.1749-6632.1999.tb09468.x. Ann N Y Acad Sci. 1999. PMID: 10372169
-
Non-invasive assessment of the effects of iontophoresis on human skin in-vivo.J Pharm Pharmacol. 2001 Jun;53(6):769-77. doi: 10.1211/0022357011776117. J Pharm Pharmacol. 2001. PMID: 11428652 Review.
-
How to Choose a Proper Theoretical Analysis Model Based on Cell Adhesion and Nonadhesion Impedance Measurement.ACS Sens. 2021 Mar 26;6(3):673-687. doi: 10.1021/acssensors.0c02710. Epub 2021 Mar 16. ACS Sens. 2021. PMID: 33724797 Review.
Cited by
-
A review of bio-impedance devices.Med Biol Eng Comput. 2023 May;61(5):927-950. doi: 10.1007/s11517-022-02763-1. Epub 2023 Jan 13. Med Biol Eng Comput. 2023. PMID: 36637716 Review.
-
On the Breathability of Epidermal Polymeric-Printed Tattoo Electrodes.ACS Appl Electron Mater. 2025 Feb 5;7(4):1408-1414. doi: 10.1021/acsaelm.4c01902. eCollection 2025 Feb 25. ACS Appl Electron Mater. 2025. PMID: 40028656 Free PMC article.
-
Using electrocardiogram electrodes to monitor skin impedance spectroscopic response when skin is subjected to sustained static pressure.Skin Health Dis. 2023 Mar 6;3(4):e225. doi: 10.1002/ski2.225. eCollection 2023 Aug. Skin Health Dis. 2023. PMID: 37538331 Free PMC article.
-
Practice Guidelines for Monitoring Neuromuscular Blockade-Elements to Change to Increase the Quality of Anesthesiological Procedures and How to Improve the Acceleromyographic Method.J Clin Med. 2024 Mar 29;13(7):1976. doi: 10.3390/jcm13071976. J Clin Med. 2024. PMID: 38610741 Free PMC article. Review.
-
Detecting and monitoring incontinence associated dermatitis: Does impedance spectroscopy have a part to play?Proc Inst Mech Eng H. 2024 Jun;238(6):655-666. doi: 10.1177/09544119231159178. Epub 2023 Mar 7. Proc Inst Mech Eng H. 2024. PMID: 36882988 Free PMC article. Review.
References
-
- Guy R.H.: ‘Current status and future prospects of transdermal drug delivery’, Pharm. Res., 1996, 13, (12), pp. 1765–1769 - PubMed
-
- Guy R.H., and Hadgraft J.: ‘Transdermal drug delivery: a perspective’, J. Control. Release, 1987, 4, (4), pp. 237–251
-
- Sachan R., and Bajpai M.: ‘Transdermal drug delivery system: a review’, 2013.
-
- Riviere J.E., and Heit M.C.: ‘Electrically assisted transdermal drug delivery’, Pharm. Res., 1997, 14, (6), pp. 687–697 - PubMed
-
- Kinouchi Y., Iritani T., and Morimoto T. et al.: ‘Fast in vivo measurements of local tissue impedances using needle electrodes’, Med. Biol. Eng. Comput., 1997, 35, (5), pp. 486–492 - PubMed
MeSH terms
LinkOut - more resources
Full Text Sources
Research Materials
Miscellaneous
