. 2020 Jun 1;219(6):e201910210.
doi: 10.1083/jcb.201910210.

CRISPR-Cas12a-assisted PCR tagging of mammalian genes

Affiliations

CRISPR-Cas12a-assisted PCR tagging of mammalian genes

Julia Fueller et al. J Cell Biol. .

Abstract

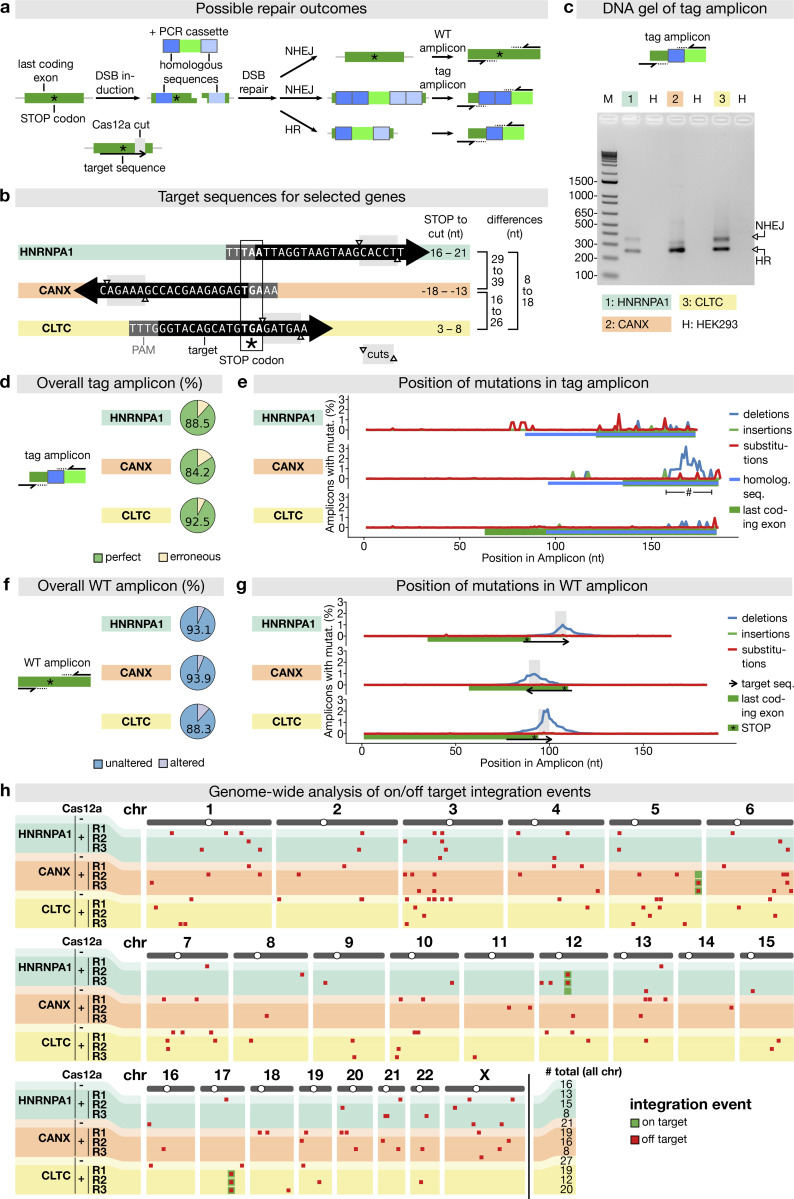
Here we describe a time-efficient strategy for endogenous C-terminal gene tagging in mammalian tissue culture cells. An online platform is used to design two long gene-specific oligonucleotides for PCR with generic template cassettes to create linear dsDNA donors, termed PCR cassettes. PCR cassettes encode the tag (e.g., GFP), a Cas12a CRISPR RNA for cleavage of the target locus, and short homology arms for directed integration via homologous recombination. The integrated tag is coupled to a generic terminator shielding the tagged gene from the co-inserted auxiliary sequences. Co-transfection of PCR cassettes with a Cas12a-encoding plasmid leads to robust endogenous expression of tagged genes, with tagging efficiency of up to 20% without selection, and up to 60% when selection markers are used. We used target-enrichment sequencing to investigate all potential sources of artifacts. Our work outlines a quick strategy particularly suitable for exploratory studies using endogenous expression of fluorescent protein-tagged genes.


Figures

Figure 1.
Figure 1.
Endogenous C-terminal gene tagging in mammalian cells using PCR tagging. (a) For tag insertion before the STOP codon of an ORF, two gene-specific tagging oligos (termed M1 and M2) are designed using an online tool (www.pcr-tagging.com; Fueller et al., 2019). A tagging PCR with a generic template plasmid generates the gene-specific PCR cassette. The template plasmid provides the tag (e.g., a fluorescent protein), a possible selection marker, and a Pol III promoter. For gene tagging, the PCR cassette is transfected into the target cell together with a helper plasmid containing a Cas12a endonuclease gene. This leads to insertion of the PCR cassette into the chromosome, which yields a fusion of the tag (e.g., GFP) with the target gene. (b) Tagging principle: the PCR cassette contains a crRNA sequence that is expressed inside the cell via an U6 promoter (Pol III promoter). The crRNA directs Cas12a (which is expressed from the helper plasmid) to the target locus close to the insertion site. Stimulated by the DSB, the linear PCR cassette is then inserted into the genome. The homology arm of the M1 tagging oligo thereby directs in-frame fusion of the tag with the target ORF, leading to the expression of a tagged protein from the target locus. Integration leads to destruction of the crRNA target site, thus preventing recleavage of the modified locus. (c) Efficiency of C-terminal mNeonGreen-tagging for 16 organelle specific genes. For each gene, specific M1/M2 tagging oligos were used to amplify an mNeonGreen containing template plasmid. The resulting PCR cassettes were transfected in HEK293T cells. HOECHST staining of live cells and analysis by fluorescence microscopy were performed 3 d after transfection. Fractions of cells exhibiting the expected localization or diffuse cytoplasmic green fluorescence are shown. For information on selected genes, see Table S1. Data from one representative experiment are shown. Additional data are shown in Data S1. (d) Representative images from HEK293T cells 3 d after transfection. mNeonGreen fluorescence and HOECHST staining (DNA) are shown. In addition to the expected localization, cells showing diffuse cytoplasmic fluorescence (arrows) are detected. (e) Tagging is specific for the crRNA and guided by the homology arms. Efficiency of control transfections (see Fig. S2 a for representative examples). * in this transfection indicates that a matching combination of crRNA and homology arms was used, but the crRNA was expressed from a different PCR fragment. ** indicates that in this case, a PCR cassette was used where the crRNA (for CANX) led to cleavage of a different gene than the one specified by the homology arms (HNRNPA1). A small fraction of cells (<0.02%, corresponding to five cells in the entire well) exhibiting an ER localization pattern typically seen for CANX was observed, indicating cassette integration at the CANX locus, e.g., via c-NHEJ. Data from one experiment are shown. Additional data are shown in Data S1.
Figure S1.
Figure S1.
PCR strategy. PCR is performed with M1 and M2 tagging oligos and a template cassette that contains the tag. The M1 and M2 tagging oligos provide the homology arms (HA; ∼55–90 nt in length) for targeted integration. The M2 tagging oligo additionally provides the direct repeat and a protospacer sequence (orange) for a Cas12a endonuclease. The template cassette contains the desired tag and additional features, such as a selection marker. It also contains the U6 Pol III promoter for driving crRNA expression. PCR yields a linear DNA fragment (PCR cassette) that contains homology arms to the target locus and a functional crRNA gene to cleave the locus.
Figure S2.
Figure S2.
Exploring transfection parameters. (a) Control transfections to demonstrate the effect of the crRNA and the presence of homology arms (HAs). Locus specificity of the homology arms and the crRNA as indicated (related to Fig. 1 e). (b) Impact of transfected amounts of DNA on tagging efficiency using HEK293T cells. Transfected amounts of PCR cassette and Cas12a plasmid as indicated. Always 1 µg of DNA was transfected using lipofectamine. pUC18 was used as neutral DNA. Tagging efficiency was determined 3 d later by HOECHST staining and live-cell imaging. Data from one representative experiment are shown. (c) HEK293T cells were transfected for 4 h or overnight using Lipofectamine 2000 or transfected using electroporation, as indicated. Tagging efficiency was determined 3 d later as described in a. Data from one representative experiment are shown. (d) HEK293T cells were transfected in duplicates by electroporation with Cas12a protein, Cas12a-encoding mRNA, or Cas12-encoding plasmid. For protein-based expression, 100 ng of PCR cassette while for mRNA and plasmid 1.5 µg PCR cassette were electroporated. Error bars indicate range between the technical duplicates.
Figure 2.
Figure 2.
Analysis of the fate of the transfected PCR cassette using target enrichment sequencing. (a) Anchor-Seq (Meurer et al., 2018) is based on a target enrichment procedure that uses an oligo in the mNeonGreen gene to enrich adjacent sequences for analysis by next-generation sequencing using a paired end sequencing protocol (reads 1 and 2). (b) Anchor-Seq analysis of adjacent sequences of the PCR cassette from HEK293T cells 3 d after transfection, for the four genes shown individually, and from cells transfected with a mixture of PCR cassettes for different genes (cassettes from the genes shown in Fig. 1 c; labeled with Mixture). Fraction of reads (in percentages) observed for the different categories, where H and T stand for head and tail of the PCR cassette, respectively. Combinations of the letter denote the detected fusion, homo denotes fusion of two ends from a PCR cassette targeting the same gene, and hetero from PCR cassettes targeting different genes. (c) HEK293T cells transfected with PCR cassettes as indicated using wild-type mNeonGreen gene or lacking ATG translation initiation codons within the first 10 codons of the mNeonGreen ORF. Live-cell fluorescence microscopy of HOECHST-stained cells was used to determine the fraction of cells (in %) with correct localization and diffuse cytoplasmic fluorescence. Data from three replicates are shown. Error bars indicate SD. (d) HEK293T cells transfected with PCR cassettes for HNRNPA1 or TOMM20 were passaged for the indicated time periods. Analysis as in panel c. Data from three replicates are shown. Error bars indicate SD.
Figure 3.
Figure 3.
Tagging efficiency as a function of different parameters. (a) Length of homology arms. M1 and M2 tagging oligos containing the indicated sequence lengths of homology arm (5′-HA and 3′-HA, respectively) to the destination locus were used for PCR tagging of the HNRNPA1 locus in HEK293T cells. Tagging efficiency was estimated 3 d after transfection as described before. Data from three replicates are shown. Error bars indicate SD. (b) PCR cassettes containing various types of ends to direct the choice of DNA repair pathway: homology arms (90-bp and 55-bp homology, for HR; A), blunt ended arms without homology to the target locus (blunt; B), HgaI cut (D), and uncut ends (C). Cutting with the type IIS restriction enzyme HgaI results in 5-nt 3′ overhangs that are complementary to the overhangs generated by the crRNA directed Cas12a-cleavage of the destination locus. Tagging efficiency was estimated 3 d later as described in panel a using HEK293T cells. Data from three replicates are shown. Error bars indicate SD. (c) Use of modified and/or purified oligos. M1/M2 tagging oligos with the indicated number of phosphorothioate bonds and/or biotin as indicated were used for generation of PCR cassettes. All oligos were cartridge purified except for the ones denoted with PAGE, which were size selected using PAGE. Tagging efficiency was estimated 3 d after transfection as described before using HEK293T cells. Data from three replicates are shown. Error bars indicate SD.
Figure 4.
Figure 4.
Fidelity of tag integration and off-target events in unselected cell populations. (a) Schematic representation of possible repair outcomes following a Cas12a cut at the target site: cassette integration by HR, integration by c-NHEJ, and DSB repair without cassette integration. (b) Target sequences for three selected genes and the resulting distances between induced DSB and the STOP codon of the gene. (c) PCR amplification of the insertion junction of the respective genes (tag amplicon). HEK293 cells were transfected with mNeonGreen containing PCR cassettes, and PCR was performed 6 d after transfection. The upper band corresponds to junctions generated by insertion via c-NHEJ and the lower via HR as indicated. (d) Sequencing of tag amplicons formed by HR of the same genes as in panel c (>10,000 reads per gene), but using cells 18 d after transfection. The frequencies of reads exhibiting perfect and erroneous exon-tag junctions are given. (e) The position of observed mutations in the tag amplicons. The 2–3% frequency (#) of mutations in the insertion junction observed for CANX is caused mostly by small deletions and can be explained by reconstitution of a crRNA targeting site after tag integration with the noncanonical PAM site CCTG in the CANX-mNeonGreen fusion. (f) Amplification of the crRNA cleavage site of unmodified alleles in cells of panel d. The frequencies of reads exhibiting unaltered and altered sequences when compared with the wild-type sequence are given. (g) Samples as in panel f. The position and frequency of specific types of mutations across all reads are shown. (h) Off-target integration events detected by Anchor-Seq for the selected genes in three biological replicates in the presence of Cas12a and in one biological replicate without Cas12a. Anchor-Seq samples were prepared using cells 30 d after transfection from HEK293 cells transfected with mNeonGreen-containing PCR cassettes for the indicated genes. # total, number of detected integration sites.
Figure 5.
Figure 5.
Antibiotic selection and simultaneous tagging of two loci. (a) Enrichment of HEK293T cells expressing correctly localized fusion proteins using Zeocin or Puromycin selection as indicated. Antibiotics selection was started 3 d after transfection. Fractions of cells exhibiting localized or diffuse cytoplasmic fluorescence are shown. Data from one representative experiment are shown. Additional data are shown in Data S1. (b) Double transfection of cells using PCR cassette reporters for the indicated genes and with the indicated fluorescent protein. For counting, only cells exhibiting correctly localized fluorescence signals were considered (ER localization for CANX tagging, nuclear localization for HNRNPA1 tagging, see Fig. S4). Data from one representative experiment are shown. Additional data are shown in Data S1. (c) Double tagging of the genes indicated in the images. Representative cells are shown. (i–iii) Single-plane images. (iv) A maximum projection of multiple planes spanning the upper half of a cell nucleus is shown.
Figure S3.
Figure S3.
Analysis of clones from a CANX-mNeonGreen tagging experiment. PCR analysis of single clones using primer for PCR of characteristic fragments indicative for correctly inserted fragments. Primers that anneal to chromosomal DNA were chosen to reside outside of the sequences that are contained in the homology arms for recombination. For Western blot analysis, antibodies specific to mNeonGreen or to Calnexin were used.
Figure S4.
Figure S4.
Multi-color integration. Double tagging using a mixture of HNRNPA1-mScarlet-i and HNRNPA1-mNeonGreen PCR cassettes. For analysis, dual color fluorescence images were acquired.
Figure 6.
Figure 6.
PCR tagging in different cell lines. (a) Transfection of U2OS cells using Lipofectamine 2000. After 3 d, the cells were analyzed using HOECHST staining and live-cell imaging. Data from one representative experiment are shown. Additional data are shown in Data S1. (b) Electroporation of mESCs with PCR cassettes for tagging the indicated genes. After 3 d, the cells were fixed using paraformaldehyde and analyzed. We counted microcolonies that have at least one positive cell. Note that for these cells, we did not quantify cells with diffuse cytoplasmic fluorescence, since paraformaldehyde fixation before imaging leads to an increase in cellular background fluorescence. This prevented the detection of the weak cytoplasmic diffuse mNeonGreen fluorescence. Data from one representative experiment are shown. Additional data are shown in Data S1. (c) Electroporation of RPE-1 cells. Cells were analyzed 2 d later. Experimental setup similar to b. Data from three replicates are shown. Error bars indicate SD. (d) Electroporation of C2C12 cells. Cells were analyzed 2 d later. Experimental setup similar to b. Data from two replicates are shown. Error bars indicate SD.
Figure S5.
Figure S5.
Tagging in C2C12 and HeLa cells. (a) Sample images from C2C12 cells (Fig. 6 d), 5 d after transfection. (b) HeLa cells transfected using Lipofectamine 2000. Cells were grown for 3 d without, and 10 d in the presence of Zeocin using HOECHST staining and live-cell imaging. Data from one representative experiment are shown.
Figure 7.
Figure 7.
PCR tagging enables C-terminal tagging of the majority of human genes. (a) Search space for Cas12a-PAM sites suitable for C-terminal protein tagging. PCR cassette insertion into the genome using PAM sites located in the confined search space (blue) led to a disruption of the crRNA target sequence. This would not be the case for PAM sites in the extended search space (orange). To prevent recleavage after insertion, the homology arm of the PCR fragment (provided by the M2 tagging oligo) is designed such that a small deletion in the region after the STOP codon does lead to the disruption of the crRNA target site. (b) Fraction (in percentage) of human genes with suitable PAM sites near the STOP codon, as a function of the confined and extended search spaces (a) and different Cas12a variants as indicated. For calculation, we used the following PAM sites: hLbCas12a/hAsCas12a: TTTV; LbCas12a RR variant: TYCV, TYTV; AsCas12a, RVR variant: TATV; AsCas12a RR variant: TTTV, TYCV; enAsCas12a: TTYN, VTTV, TRTV, VTCC, HSCC, TACA, TTAC, CACC (Tier 1 and 2 PAM sites). (c) Tagging of the indicated genes in HEK293T cells. Helper plasmids with different Cas12a genes, as indicated. PCR cassettes contained crRNA genes with matching PAM site specificity. For TOMM70, three different Cas12a variants were tested using three different crRNA sequences for AsCas12a, as indicated. Tagging efficiency was determined 3 d after transfection.
Figure 8.
Figure 8.
PCR tagging Toolkit for mammalian cells. (a) Schematic outline of the template plasmids provided. (b) Examples of HNRNPA1 tagging using different available cassettes. Complete list of features and sequence files is provided in Table 1 and Table S2. Western blot analysis was performed 3 d after transfection with crude lysate of a cell pool. Fluorescence microscopy was performed using cells 3 d after transfection. HA, hemagglutinin tag.

Similar articles

Cited by

References

    1. Agudelo D., Duringer A., Bozoyan L., Huard C.C., Carter S., Loehr J., Synodinou D., Drouin M., Salsman J., Dellaire G., et al. . 2017. Marker-free coselection for CRISPR-driven genome editing in human cells. Nat. Methods. 14:615–620. 10.1038/nmeth.4265 - DOI - PubMed
    1. Anand R., Beach A., Li K., and Haber J.. 2017. Rad51-mediated double-strand break repair and mismatch correction of divergent substrates. Nature. 544:377–380. 10.1038/nature22046 - DOI - PMC - PubMed
    1. Arimbasseri A.G., Rijal K., and Maraia R.J.. 2013. Transcription termination by the eukaryotic RNA polymerase III. Biochim. Biophys. Acta. 1829:318–330. 10.1016/j.bbagrm.2012.10.006 - DOI - PMC - PubMed
    1. Attali D. 2017. shinyjs: Easily Improve the User Experience of Your Shiny Apps in Seconds. R package version 1.0. https://cran.r-project.org/web/packages/shinyjs/index.html
    1. Baudin A., Ozier-Kalogeropoulos O., Denouel A., Lacroute F., and Cullin C.. 1993. A simple and efficient method for direct gene deletion in Saccharomyces cerevisiae. Nucleic Acids Res. 21:3329–3330. 10.1093/nar/21.14.3329 - DOI - PMC - PubMed

Publication types

MeSH terms