

G3BP1-linked mRNA partitioning supports selective protein synthesis in response to oxidative stress
- PMID: 32406909
- PMCID: PMC7337521
- DOI: 10.1093/nar/gkaa376
G3BP1-linked mRNA partitioning supports selective protein synthesis in response to oxidative stress
Abstract
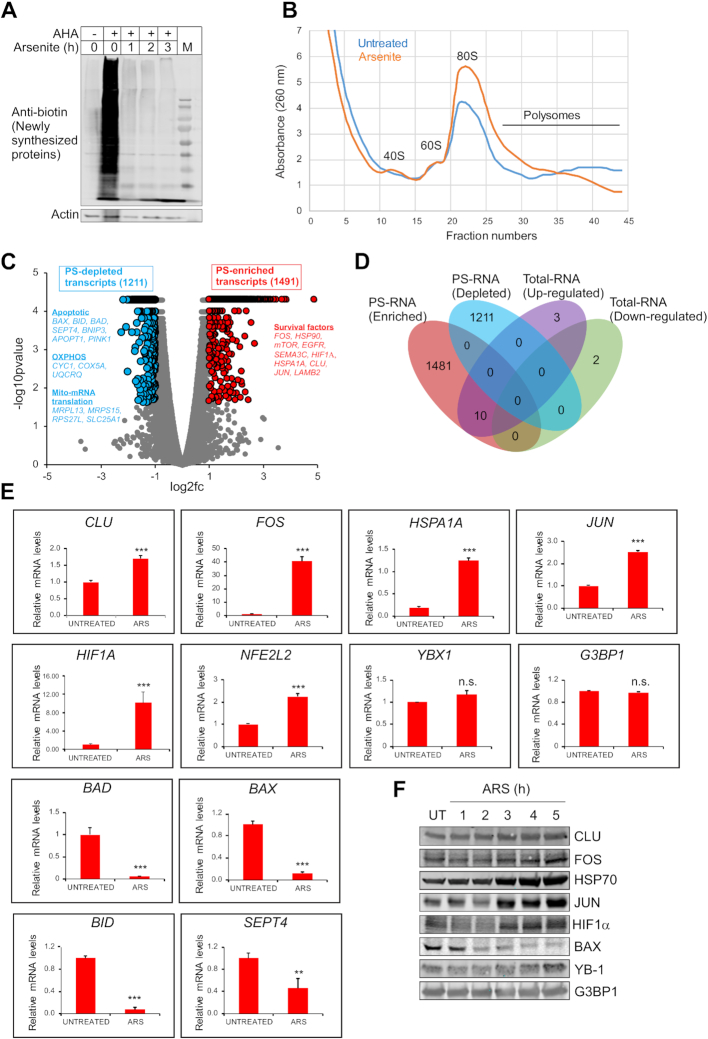
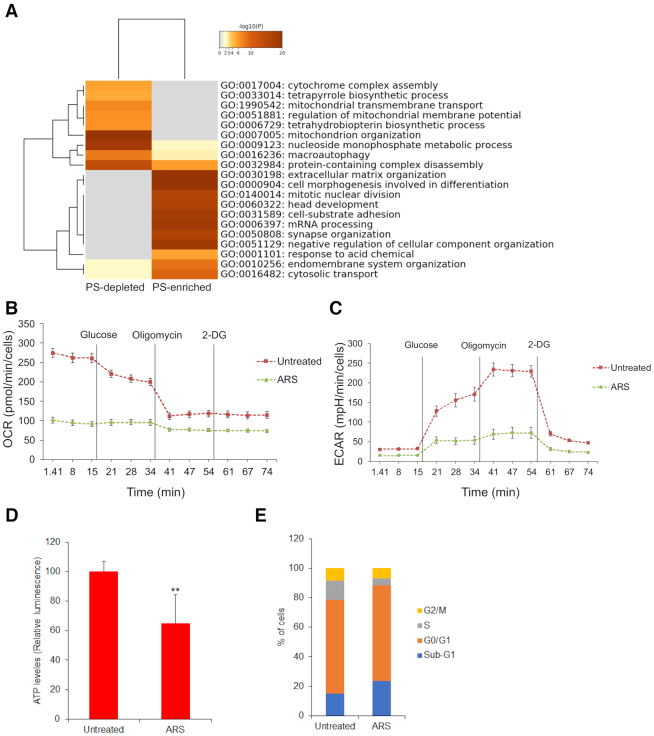
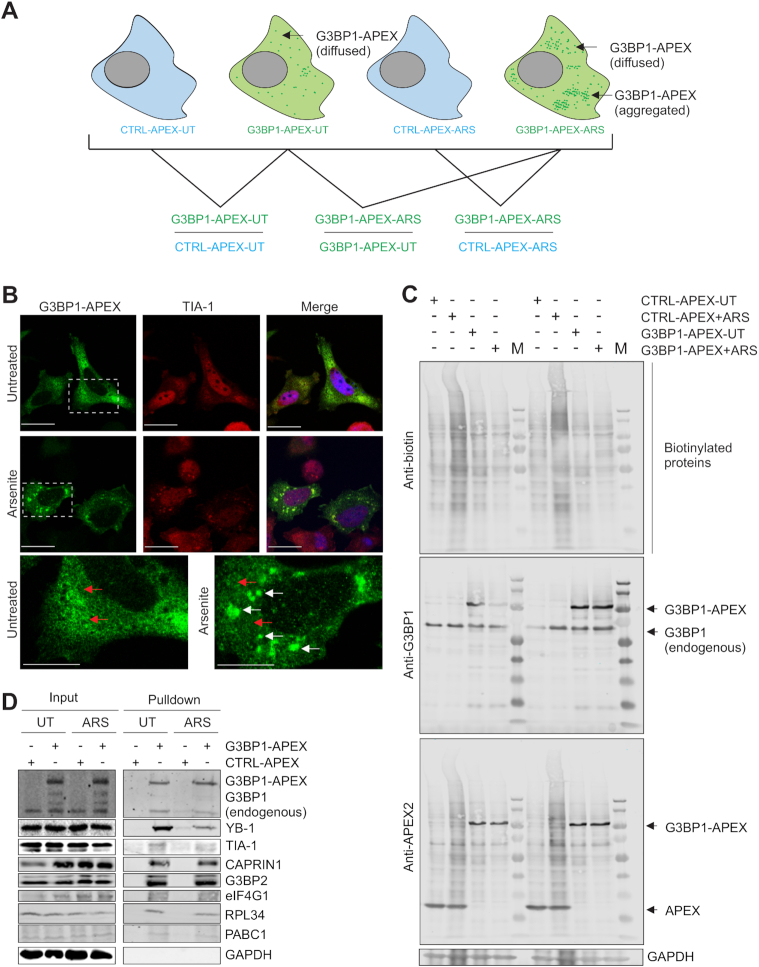
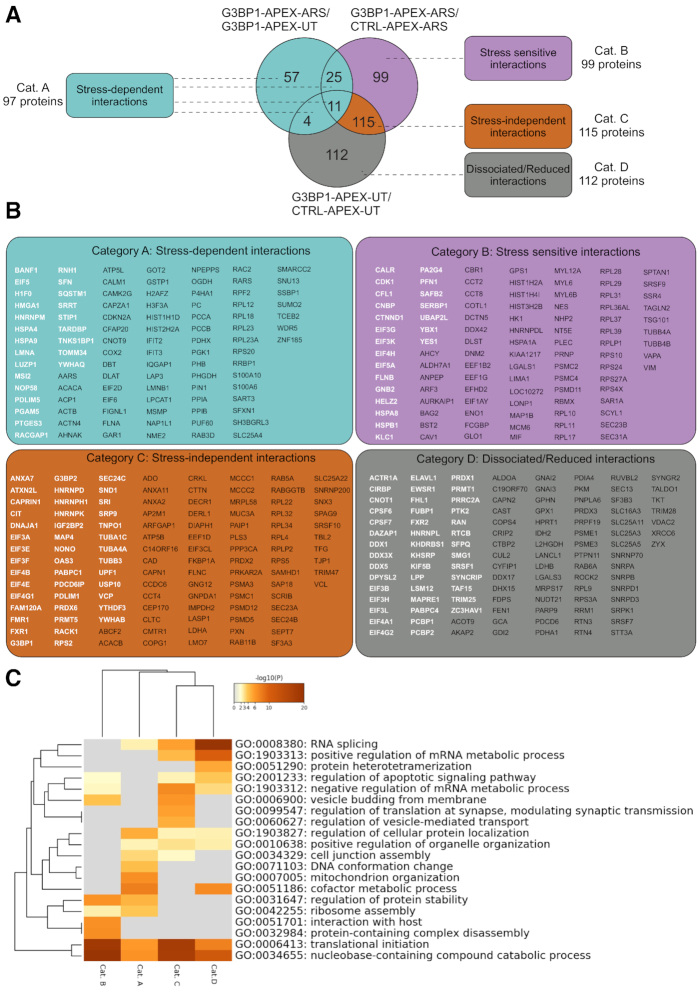
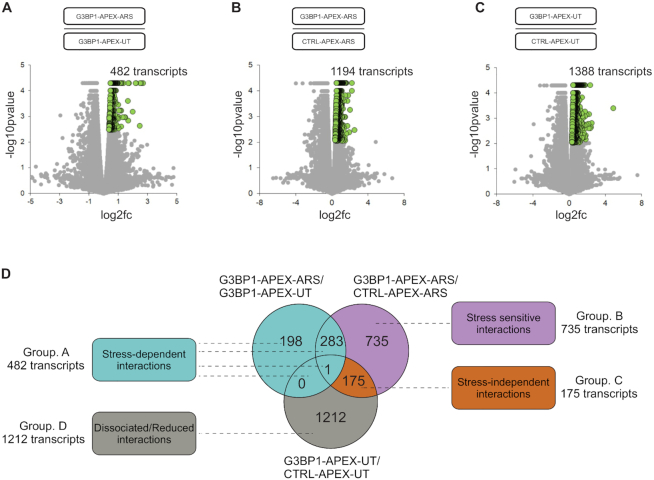
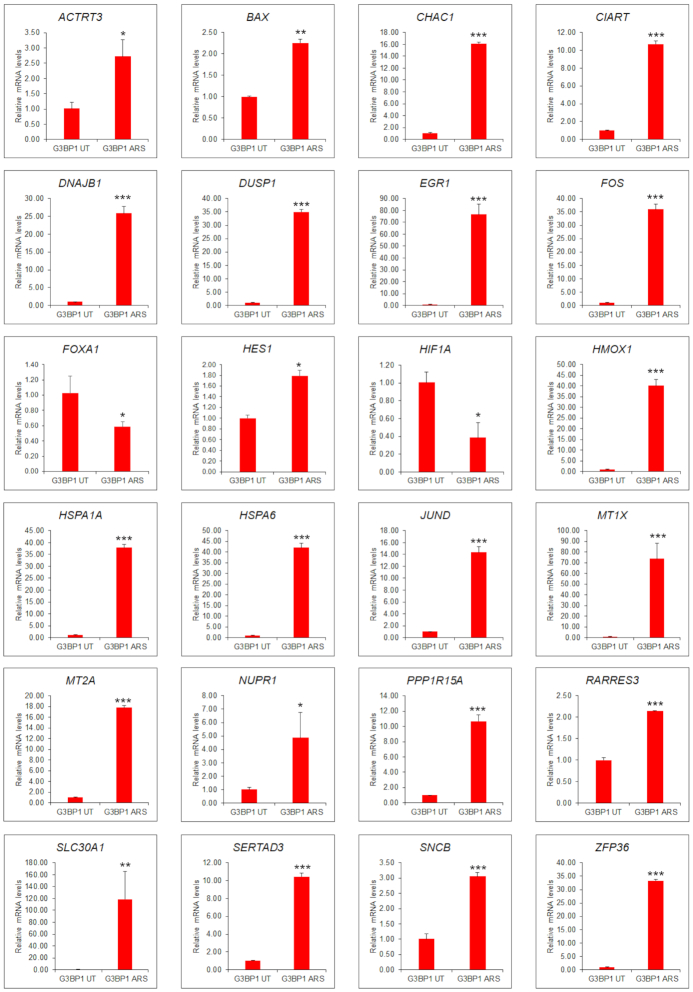
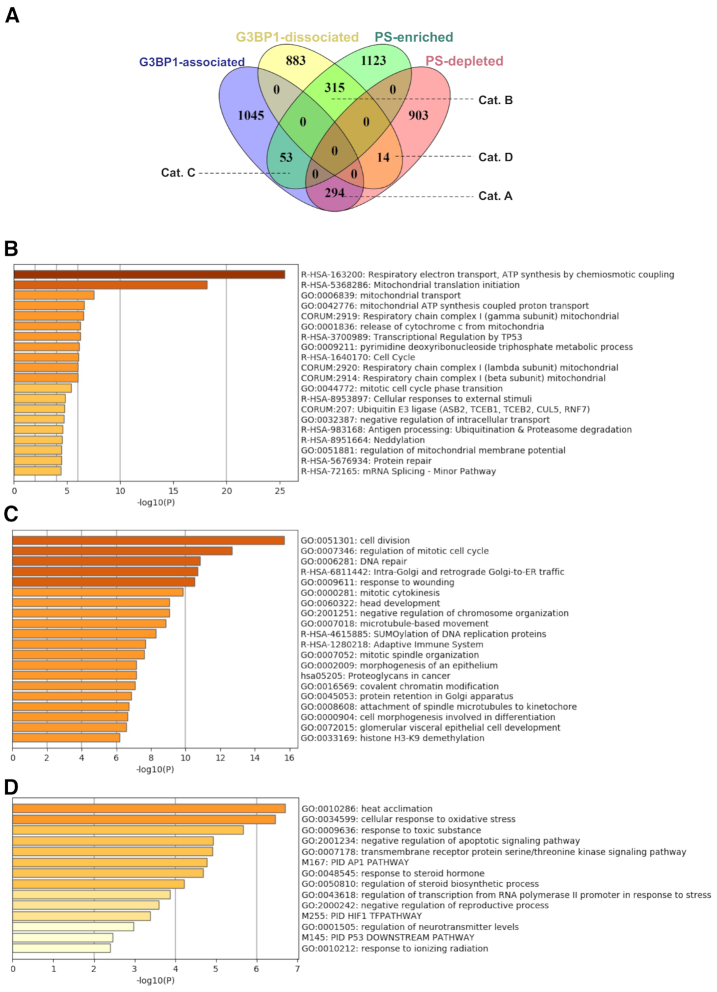
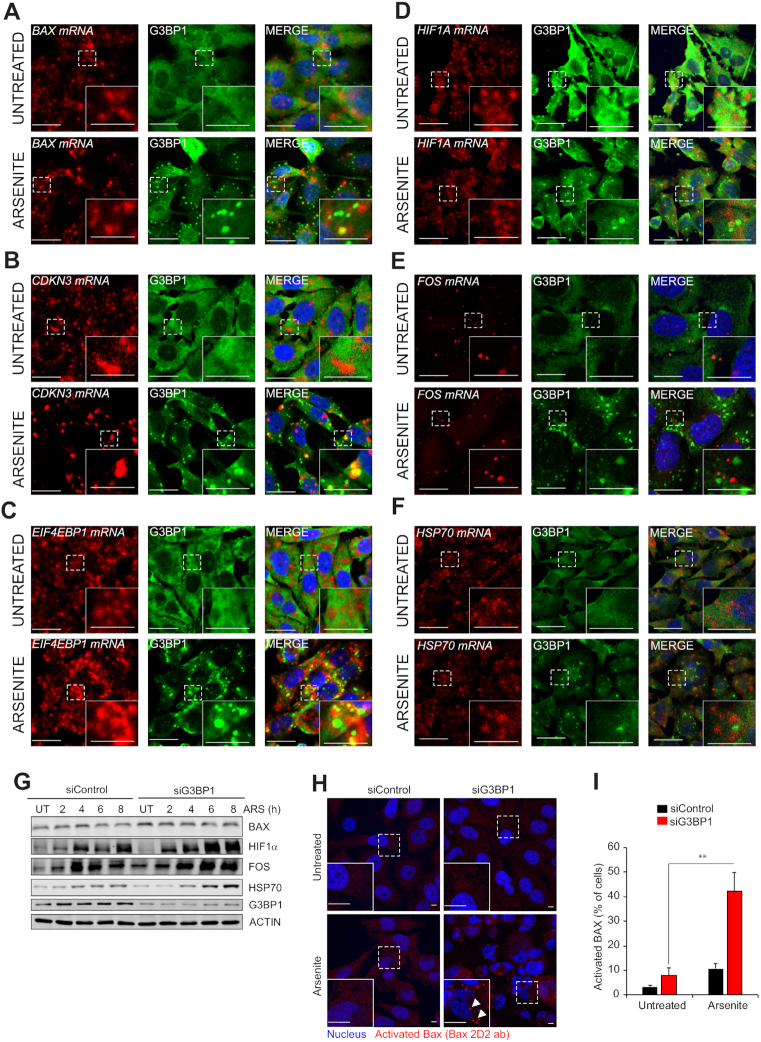
Cells limit energy-consuming mRNA translation during stress to maintain metabolic homeostasis. Sequestration of mRNAs by RNA binding proteins (RBPs) into RNA granules reduces their translation, but it remains unclear whether RBPs also function in partitioning of specific transcripts to polysomes (PSs) to guide selective translation and stress adaptation in cancer. To study transcript partitioning under cell stress, we catalogued mRNAs enriched in prostate carcinoma PC-3 cell PSs, as defined by polysome fractionation and RNA sequencing (RNAseq), and compared them to mRNAs complexed with the known SG-nucleator protein, G3BP1, as defined by spatially-restricted enzymatic tagging and RNAseq. By comparing these compartments before and after short-term arsenite-induced oxidative stress, we identified three major categories of transcripts, namely those that were G3BP1-associated and PS-depleted, G3BP1-dissociated and PS-enriched, and G3BP1-associated but also PS-enriched. Oxidative stress profoundly altered the partitioning of transcripts between these compartments. Under arsenite stress, G3BP1-associated and PS-depleted transcripts correlated with reduced expression of encoded mitochondrial proteins, PS-enriched transcripts that disassociated from G3BP1 encoded cell cycle and cytoprotective proteins whose expression increased, while transcripts that were both G3BP1-associated and PS-enriched encoded proteins involved in diverse stress response pathways. Therefore, G3BP1 guides transcript partitioning to reprogram mRNA translation and support stress adaptation.
© The Author(s) 2020. Published by Oxford University Press on behalf of Nucleic Acids Research.
Figures
Similar articles
-
RNA partitioning into stress granules is based on the summation of multiple interactions.RNA. 2021 Feb;27(2):174-189. doi: 10.1261/rna.078204.120. Epub 2020 Nov 16. RNA. 2021. PMID: 33199441 Free PMC article.
-
A Ca2+-Dependent Switch Activates Axonal Casein Kinase 2α Translation and Drives G3BP1 Granule Disassembly for Axon Regeneration.Curr Biol. 2020 Dec 21;30(24):4882-4895.e6. doi: 10.1016/j.cub.2020.09.043. Epub 2020 Oct 15. Curr Biol. 2020. PMID: 33065005 Free PMC article.
-
Regulation of Stress Granule Formation by Inflammation, Vascular Injury, and Atherosclerosis.Arterioscler Thromb Vasc Biol. 2019 Oct;39(10):2014-2027. doi: 10.1161/ATVBAHA.119.313034. Epub 2019 Aug 29. Arterioscler Thromb Vasc Biol. 2019. PMID: 31462091 Free PMC article.
-
Rasputin a decade on and more promiscuous than ever? A review of G3BPs.Biochim Biophys Acta Mol Cell Res. 2019 Mar;1866(3):360-370. doi: 10.1016/j.bbamcr.2018.09.001. Epub 2018 Sep 5. Biochim Biophys Acta Mol Cell Res. 2019. PMID: 30595162 Free PMC article. Review.
-
Pro-Viral and Anti-Viral Roles of the RNA-Binding Protein G3BP1.Viruses. 2023 Feb 6;15(2):449. doi: 10.3390/v15020449. Viruses. 2023. PMID: 36851663 Free PMC article. Review.
Cited by
-
RIOK1 phase separation restricts PTEN translation via stress granules activating tumor growth in hepatocellular carcinoma.Nat Cancer. 2025 Jul;6(7):1223-1241. doi: 10.1038/s43018-025-00984-5. Epub 2025 Jun 4. Nat Cancer. 2025. PMID: 40467995
-
Inhibition of PHLDA3 expression in human superoxide dismutase 1-mutant amyotrophic lateral sclerosis astrocytes protects against neurotoxicity.Brain Commun. 2024 Jul 25;6(4):fcae244. doi: 10.1093/braincomms/fcae244. eCollection 2024. Brain Commun. 2024. PMID: 39144751 Free PMC article.
-
Revisiting the Concept of Stress in the Prognosis of Solid Tumors: A Role for Stress Granules Proteins?Cancers (Basel). 2020 Sep 1;12(9):2470. doi: 10.3390/cancers12092470. Cancers (Basel). 2020. PMID: 32882814 Free PMC article. Review.
-
Regulation of AR mRNA translation in response to acute AR pathway inhibition.Nucleic Acids Res. 2022 Jan 25;50(2):1069-1091. doi: 10.1093/nar/gkab1247. Nucleic Acids Res. 2022. PMID: 34939643 Free PMC article.
-
Multiple roles of arsenic compounds in phase separation and membraneless organelles formation determine their therapeutic efficacy in tumors.J Pharm Anal. 2024 Aug;14(8):100957. doi: 10.1016/j.jpha.2024.02.011. Epub 2024 Feb 24. J Pharm Anal. 2024. PMID: 39253293 Free PMC article. Review.
References
-
- Anderson P., Kedersha N.. Stress granules: the Tao of RNA triage. Trends Biochem. Sci. 2008; 33:141–150. - PubMed
Publication types
MeSH terms
Substances
LinkOut - more resources
Full Text Sources
Molecular Biology Databases
Miscellaneous
