. 2020 Jun 19;48(11):6251-6264.
doi: 10.1093/nar/gkaa347.

Dynamic landscape and evolution of m6A methylation in human

Affiliations

Dynamic landscape and evolution of m6A methylation in human

Hui Zhang et al. Nucleic Acids Res. .

Abstract

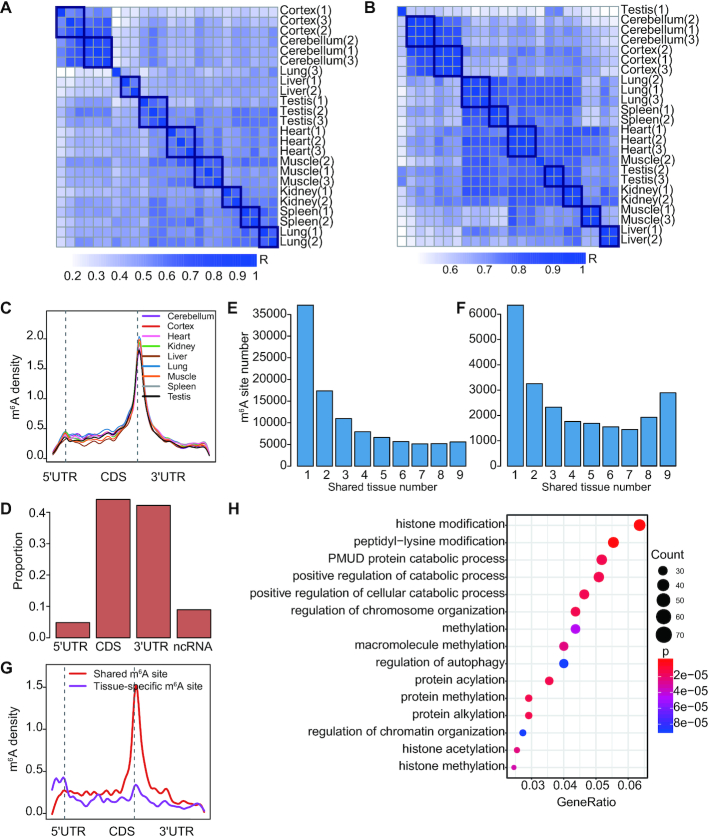
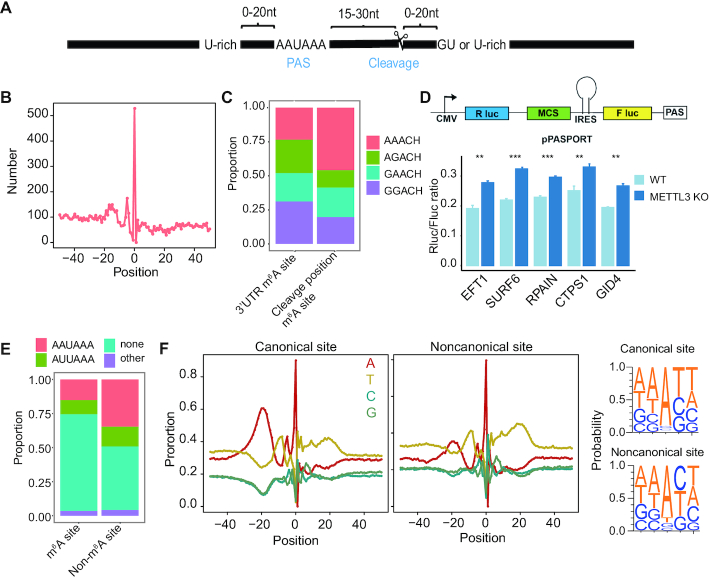
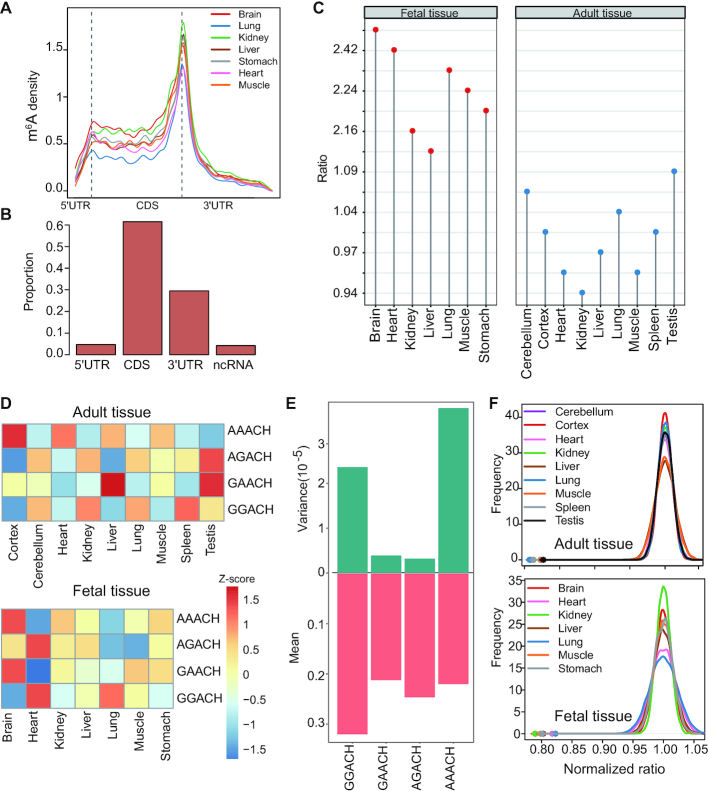
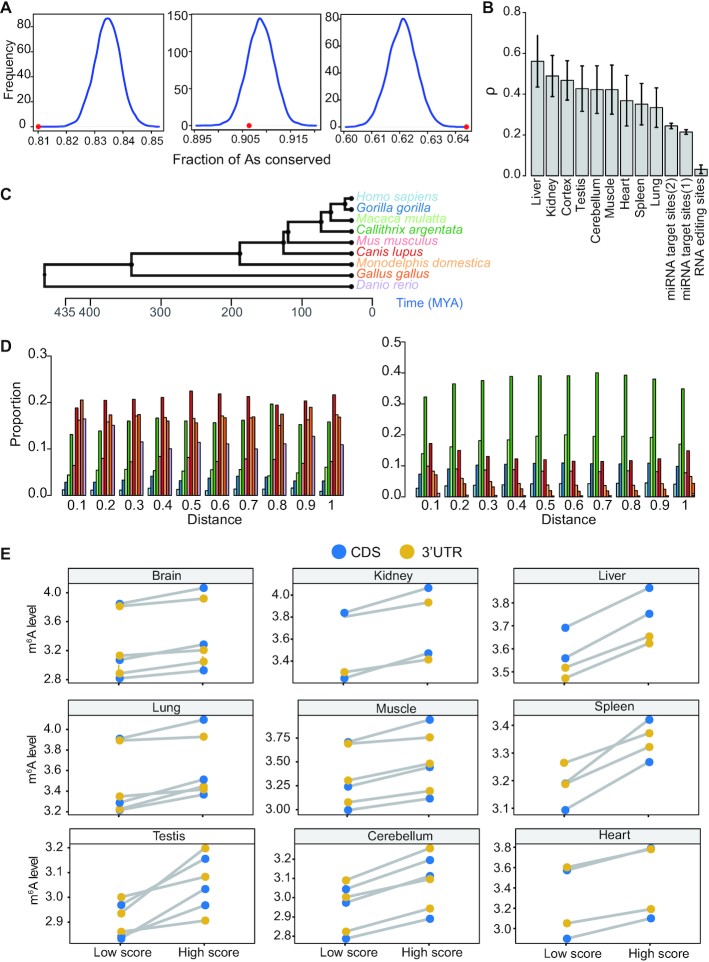
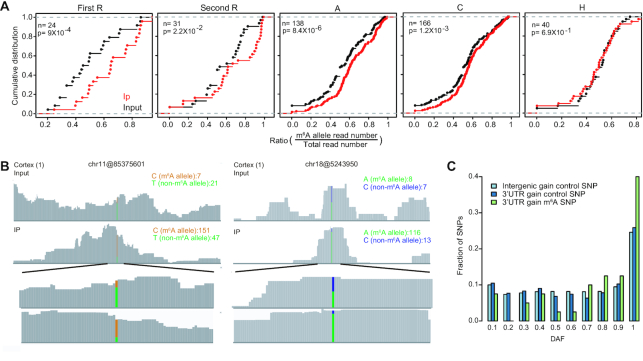
m6A is a prevalent internal modification in mRNAs and has been linked to the diverse effects on mRNA fate. To explore the landscape and evolution of human m6A, we generated 27 m6A methylomes across major adult tissues. These data reveal dynamic m6A methylation across tissue types, uncover both broadly or tissue-specifically methylated sites, and identify an unexpected enrichment of m6A methylation at non-canonical cleavage sites. A comparison of fetal and adult m6A methylomes reveals that m6A preferentially occupies CDS regions in fetal tissues. Moreover, the m6A sub-motifs vary between fetal and adult tissues or across tissue types. From the evolutionary perspective, we uncover that the selection pressure on m6A sites varies and depends on their genic locations. Unexpectedly, we found that ∼40% of the 3'UTR m6A sites are under negative selection, which is higher than the evolutionary constraint on miRNA binding sites, and much higher than that on A-to-I RNA modification. Moreover, the recently gained m6A sites in human populations are clearly under positive selection and associated with traits or diseases. Our work provides a resource of human m6A profile for future studies of m6A functions, and suggests a role of m6A modification in human evolutionary adaptation and disease susceptibility.


Figures

Figure 1.
Figure 1.
m6A profile in human adult tissues. (A, B) Heatmap of Pearson correlation on m6A peak winscores (A) or gene expression levels (B) of protein-coding genes. Gene expression levels were quantified as the number of RNA-seq reads per kilobase of transcript per million mapped reads (RPKM). (C) The distribution of m6A sites across the length of mRNA transcripts for nine adult tissues. 5′UTRs, CDSs and 3′UTRs of protein-coding genes were individually grouped into 10, 50 and 40 bins of their total length, and the percentage of m6A sites that fall within each bin was determined. (D) Genic locations of m6A sites of adult tissues. Sites in nine adult tissues were merged for analysis. Sites were annotated using Ensembl gene annotations and ANNOVAR software. ncRNA, Noncoding RNA. (E) The distribution of the numbers of m6A sites that are methylated in one or more tissues. (F) The distribution of the numbers of m6A sites that are methylated in one or more tissues. Only m6A sites within the ubiquitously expressed genes (FPKM > 3 in all tissues) were analyzed. (G) The distribution of tissue-specific or shared m6A sites across the length of mRNA transcripts for 9 adult tissues. Tissue-specific m6A sites, sites that are within the ubiquitously expressed genes and have a tau >0.6; shared m6A sites, sites that are within the ubiquitously expressed genes and have a tau <0.15. (H) GO terms enriched in the ubiquitously expressed genes with shared m6A sites (tau < 0.15). GO term analysis was performed using clusterProfiler. All ubiquitously expressed genes were used as the background. P values were corrected by Bonferroni adjustments and the top 15 enriched go terms were shown.
Figure 2.
Figure 2.
m6A methylation is enriched at non-canonical cleavage sites in 3′UTR. (A) Schematic representation of a poly(A) site and polyadenylation configuration. PAS, poly(A) signals. (B) The distribution of m6A sites around the cleavage sites. Position 0 means the cleavage position. (C) The proportion of m6A sub-motifs at the cleavage position or 3′UTR. (D) Top: Schematic diagram showing the bicistronic luciferase reporter system to measure 3′ processing efficiency. Fragment of interest was inserted into the MCS position (i.e. between Renilla (R luc) and Firefly luciferase (F luc) genes). Efficient mRNA 3′ processing at the tested PAS leads to high expression of Renilla luciferase gene and low expression of Firefly luciferase gene, while poor mRNA 3′ processing results in the opposite mode of gene expression. Therefore, the Renilla/Firefly ratio provides a quantitative measurement of the processing efficiency at the tested PAS. Bottom: Luciferase reporter assays to determine the relative PAS activity of 5 selected sites in wild-type and METTL3 knockout cells. Four biological replicates were performed and statistical significance was calculated using Student's t-test. The relative PAS activities are represented as mean ± sd. **P < 0.01; ***P < 0.001. (E) The proportion of canonical and noncanonical PAS for m6A and non-m6A cleavage sites. Canonical groups: AAUAAA, AUUAAA and other; noncanonical group, none. (F) Left: nucleotide sequence composition around all 3P-seq–identified canonical and noncanonical poly(A) sites. Position 0 means the cleavage position. Cleavage sites located in 3′UTR or 3′UTR downstream 1kb regions were analyzed. Right: The sequence context 2nt upstream and downstream of the cleavage position.
Figure 3.
Figure 3.
Developmental dynamics of m6A profile. (A) The distribution of m6A sites across the length of mRNA transcripts for 7 fetal tissues. (B) Genic locations of m6A sites of fetal tissues. Sites in seven fetal tissues were merged for analysis. (C) The ratio between the CDS m6A site number and 3′UTR m6A site number in fetal and adult tissues. (D) Heatmap showing the normalized proportion (the values were centered and scaled in the row direction) of 4 m6A sub-motifs in adult and fetal tissues. (E) Variance and mean value of the proportion of 4 sub-motifs across human adult tissues. (F) GGACH and AAACH sub-motifs tend to locate in different windows for all tissue types we studied. Color dots indicate the observed numbers of m6A peaks with both GGACH and AAACH sub-motifs. The distribution of the expected numbers was generated by the shuffled data. P is the fraction of the distribution on the left side of the dots. It is found that the observed numbers of m6A peaks with both GGACH and AAACH sub-motifs are significantly smaller than that of the shuffled data (P < 0.0001). The x-axis is the ratio of the number of windows with both sub-motifs over the mean number of windows with both sub-motifs calculated using the shuffled data.
Figure 4.
Figure 4.
Natural selection on m6A inferred by cross-species analysis. (A) Comparison of evolutionary conservation between m6A and control A sites (non- m6A RRACH). Frequency distributions of the fraction of conserved control sites in 10,000 random sets with the sample size equal to the number of m6A sites at three codon positions were plotted separately. Red dots indicate the fraction of conserved m6A sites. P is the fraction of the distribution on the right side of the dots. First codon, P = 1; second codon position, P = 0.89; third codon position, P <0.0001. (B) Estimates of ρ for m6A RRACH motifs, A-to-I RNA editing triplet motif and miRNA binding sites. ρ represents the fraction of sites under selection within functional elements, which is calculated by INSIGHT. m6A sites, m6A RRACH motifs in 3′UTR region; RNA editing sites, nonrepetitive A-to-I RNA editing sites in 3′UTR region; miRNA target sites, 3′UTR miRNA binding sites for conserved (1) or broadly conserved (2) miRNA families. The regions that match the seed region of the miRNAs were used for analysis. (C) A tree representing the schematic phylogeny of the species studied. (D) The age distribution of m6A sites (left) and control non-m6A RRACH sites (right) across the 3′UTR region. m6A sites and control sites were grouped into 10 bins based on their distance to stop codon. The age of a site was based on the most distantly related species in which the site was conserved. The color codes for the age are the same as in (C). (E) Comparison of methylation levels between m6A sites under strong and weak constraints in CDS and 3′UTR. m6A sites with top 25% (High score, strong constraint) and bottom 25% (Low score, weak constraint) rejection scores were compared. m6A peak winscore of a site was used to represent m6A level. Each dot represents the median methylation level of the CDS or 3′UTR sites; biological replicates of each tissue type were plotted, separately.
Figure 5.
Figure 5.
Positive selection inferred from SNP genotype data. (A) Comparison of the m6A allele ratio between IP and input samples of heterozygote m6A SNPs. Only heterozygote SNPs with one genotype matching the RRACH motif and the other genotype not matching the RRACH motif were considered. SNPs located in each position of RRACH motifs were analyzed, separately. P values were calculated with the Kolmogorov-Smirnov test. (B) Examples of m6A peaks with SNPs. For chr11@85375601 m6A site, the C allele (GAACT, m6A site is underlined and the SNP is marked in italics) matches the m6A motif and the T allele (GAATT) disrupts the motif. For chr18@5243950 m6A site, the A allele (AAACA) matches the m6A motif and the C allele (ACACA) disrupts the motif. For both sites, compared with the non-m6A allele, the m6A allele is highly enriched in the IP sample. (C) DAF distributions of 1,000 Genome Project SNPs of m6A RRAC motifs for 3′UTR sites. The derived alleles that create m6A motifs were analyzed. Two groups of control sites were selected: (1) ‘RRAC’ from all non-m6A RRACH motifs located at 3′UTR region; (2) ‘RRAC’ from all RRACH motifs in the intergenic region. P values were calculated with a one-sided Mann-Whitney U test comparing the DAF distribution of SNPs in m6A RRAC motif with the distribution of SNPs in control sites. 3′UTR control group versus m6A group, P = 0.00037; intergenic group versus m6A group, P = 0.000013.

Similar articles

Cited by

References

    1. Li S., Mason C.E.. The pivotal regulatory landscape of RNA modifications. Annu. Rev. Genomics Hum. Genet. 2014; 15:127–150. - PubMed
    1. Dominissini D., Moshitch-Moshkovitz S., Schwartz S., Salmon-Divon M., Ungar L., Osenberg S., Cesarkas K., Jacob-Hirsch J., Amariglio N., Kupiec M. et al. .. Topology of the human and mouse m6A RNA methylomes revealed by m6A-seq. Nature. 2012; 485:201–206. - PubMed
    1. Ramaswami G., Zhang R., Piskol R., Keegan L.P., Deng P., O’Connell M.A., Li J.B.. Identifying RNA editing sites using RNA sequencing data alone. Nat. Methods. 2013; 10:128–132. - PMC - PubMed
    1. Edelheit S., Schwartz S., Mumbach M.R., Wurtzel O., Sorek R.. Transcriptome-wide mapping of 5-methylcytidine RNA modifications in bacteria, archaea, and yeast reveals m5C within archaeal mRNAs. PLos Genet. 2013; 9:e1003602. - PMC - PubMed
    1. Li X., Xiong X., Yi C.. Epitranscriptome sequencing technologies: decoding RNA modifications. Nat. Methods. 2016; 14:23–31. - PubMed

Publication types