. 2020 Jun 19;48(11):5986-6000.
doi: 10.1093/nar/gkaa384.

Characterization of the ZFX family of transcription factors that bind downstream of the start site of CpG island promoters

Affiliations

Characterization of the ZFX family of transcription factors that bind downstream of the start site of CpG island promoters

Weiya Ni et al. Nucleic Acids Res. .

Abstract

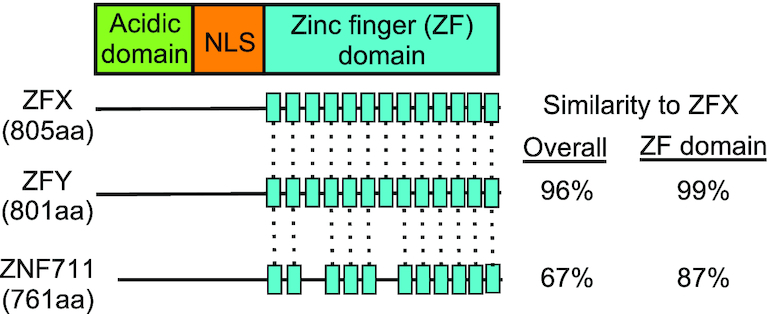
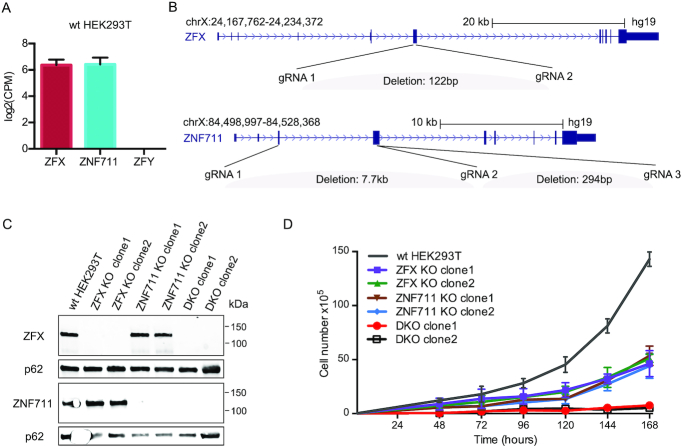
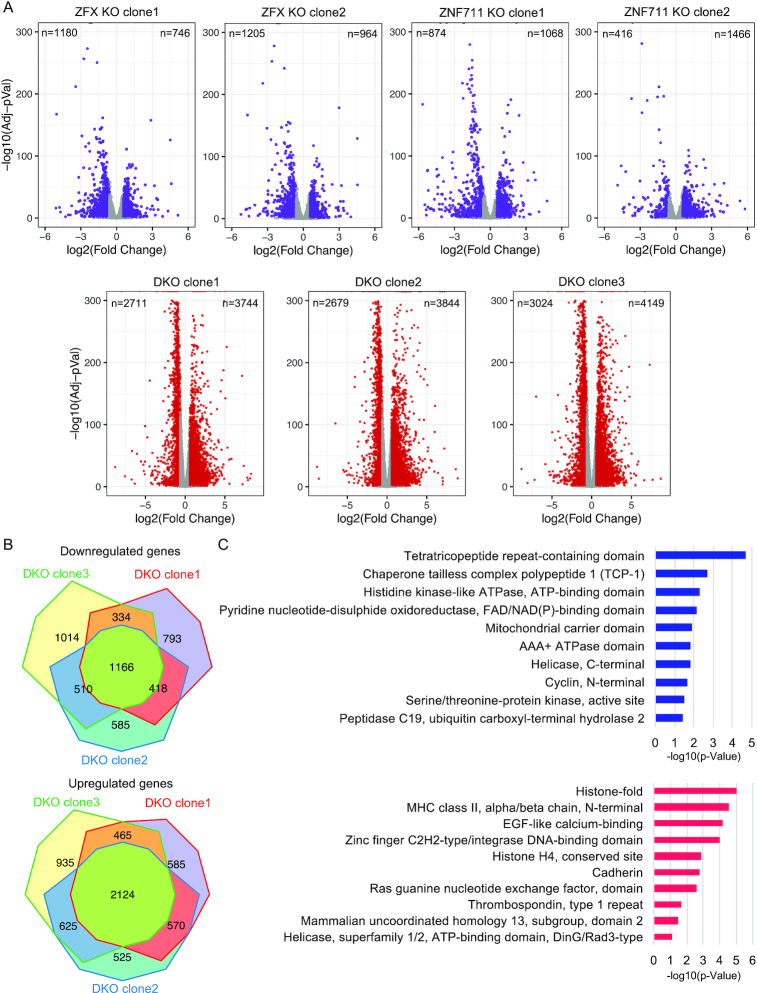
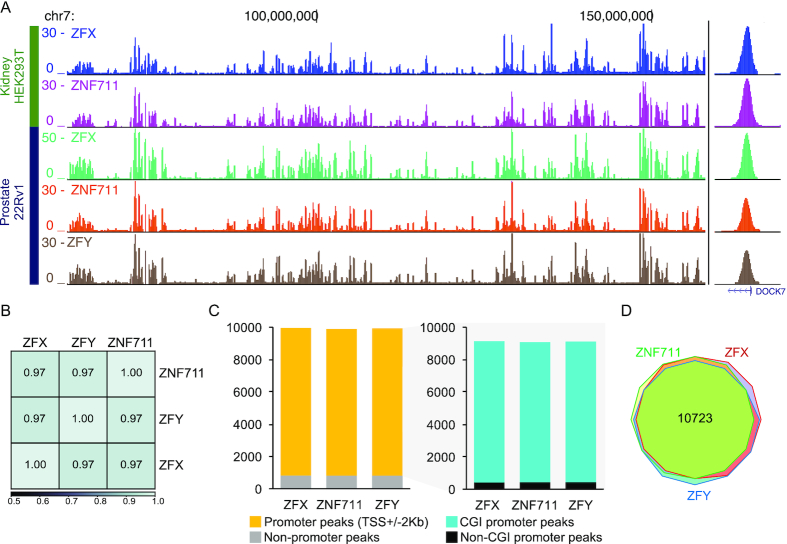
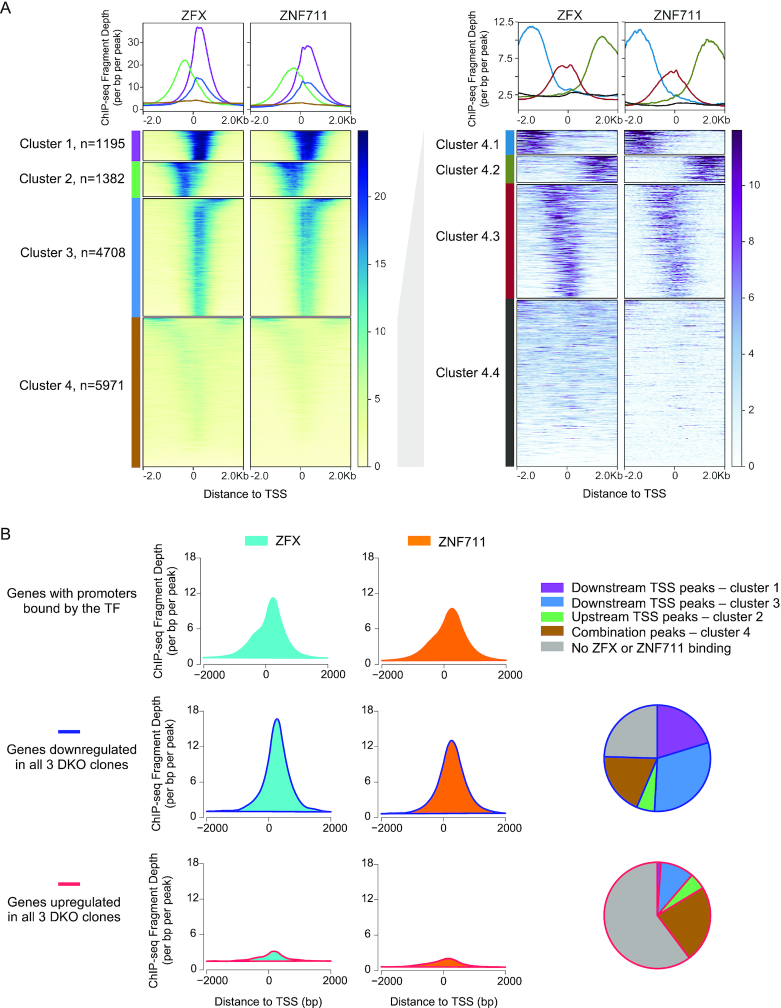
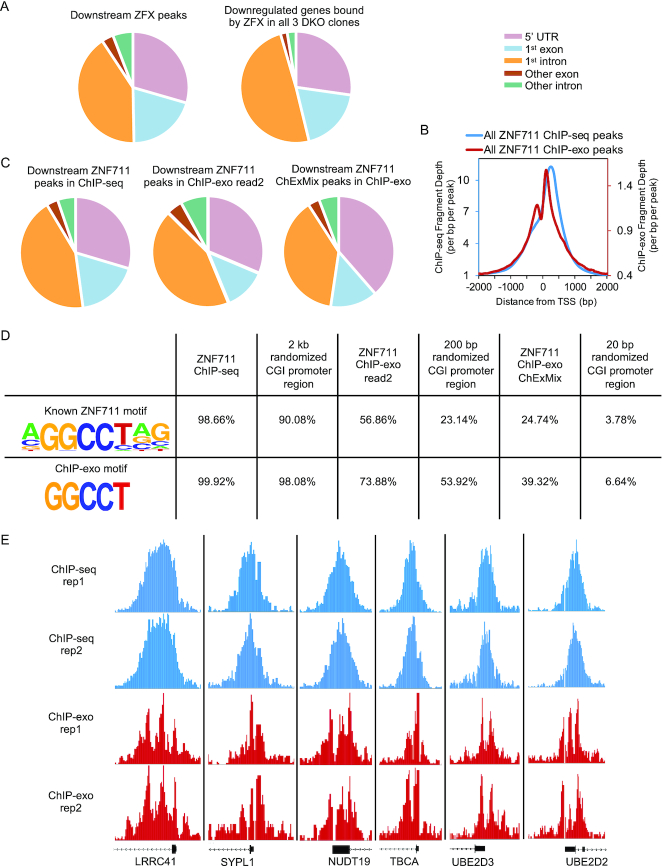
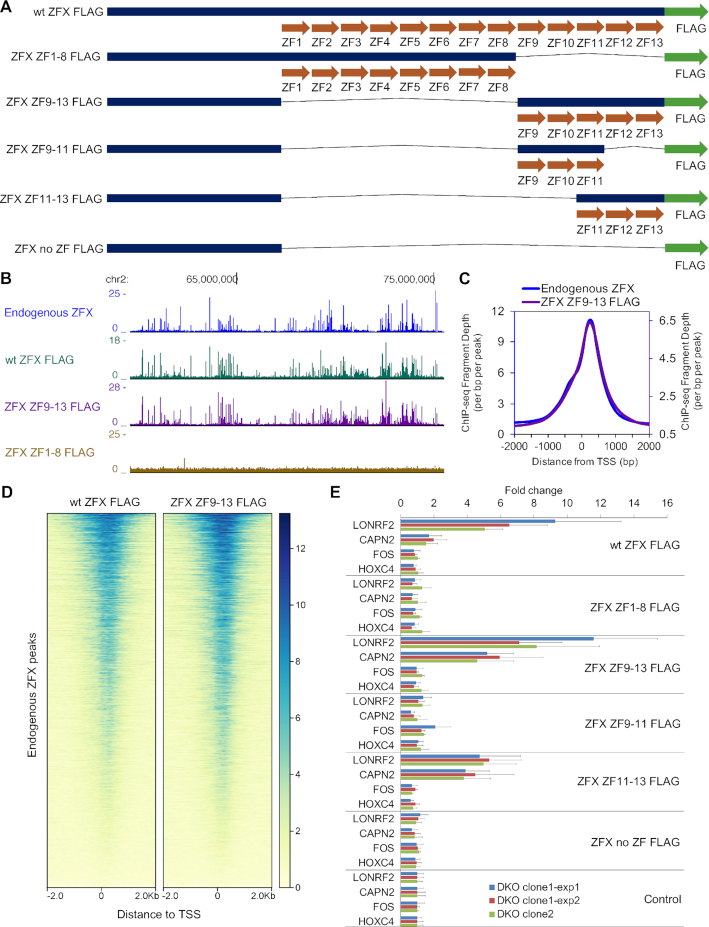
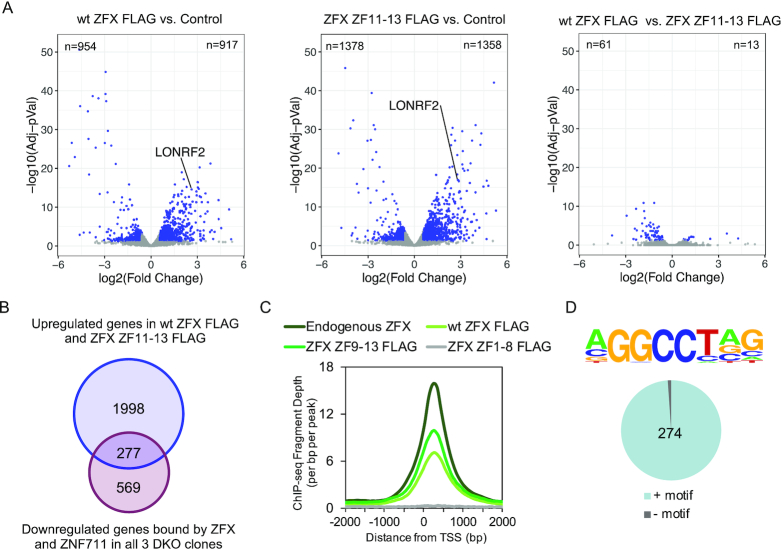
Our study focuses on a family of ubiquitously expressed human C2H2 zinc finger proteins comprised of ZFX, ZFY and ZNF711. Although their protein structure suggests that ZFX, ZFY and ZNF711 are transcriptional regulators, the mechanisms by which they influence transcription have not yet been elucidated. We used CRISPR-mediated deletion to create bi-allelic knockouts of ZFX and/or ZNF711 in female HEK293T cells (which naturally lack ZFY). We found that loss of either ZFX or ZNF711 reduced cell growth and that the double knockout cells have major defects in proliferation. RNA-seq analysis revealed that thousands of genes showed altered expression in the double knockout clones, suggesting that these TFs are critical regulators of the transcriptome. To gain insight into how these TFs regulate transcription, we created mutant ZFX proteins and analyzed them for DNA binding and transactivation capability. We found that zinc fingers 11-13 are necessary and sufficient for DNA binding and, in combination with the N terminal region, constitute a functional transactivator. Our functional analyses of the ZFX family provides important new insights into transcriptional regulation in human cells by members of the large, but under-studied family of C2H2 zinc finger proteins.


Figures

Figure 1.
Figure 1.
The ZFX gene family. Shown are gene structure schematics for ZFX, ZFY and ZNF711. Dashed lines indicate zinc fingers conserved between ZFX and the other two family members. NLS: nuclear localization sequence.
Figure 2.
Figure 2.
Loss of ZFX and ZNF711 in HEK293T cells inhibits cell proliferation. (A) Expression levels of ZFX/ZFY/ZNF711 in wt HEK293T cells. (B) Locations of gRNAs used to create CRISPR/Cas9-mediated ZFX and/or ZNF711 knockouts. The deletion of ZFX in ZFX KO clone1 and clone2 and the DKO clones were generated using ZFX gRNA1 and gRNA2. The deletion of ZNF711 in ZNF711 KO clone1 and the DKO clones was generated using ZNF711 gRNA1 and gRNA2; the deletion of ZNF711 KO clone2 was generated using ZNF711 gRNA2 and gRNA3. (C) Western blots showing the protein levels of ZFX and ZNF711 in wt HEK293T, ZFX KO clones, ZNF711 KO clones, and DKO clones; also shown is the level of p62 as a loading control. (D) Proliferation assays using wt HEK293T, two different ZFX and two different ZNF711 KO clones, and two DKO clones; data points are the mean of three biological replicates.
Figure 3.
Figure 3.
Reduction in ZFX and ZNF711 levels causes large effects on the transcriptome. (A) Volcano plots showing the differentially expressed genes (DEGs) identified via RNA-seq in comparisons of wt HEK293T versus ZFX KO clone1, KO clone2, ZNF711 KO clone1, KO clone2, DKO clone1, DKO clone2, or DKO clone3. (B) Comparison of DEGs commonly downregulated or upregulated in all three DKO clones. (C) Gene ontology analysis of the 1166 commonly downregulated and 2124 commonly upregulated genes in all three DKO clones.
Figure 4.
Figure 4.
ZFX family members have essentially identical binding patterns at CpG island promoters. (A) Browser tracks showing ZFX family member binding profiles in female HEK293T kidney cells and male 22Rv1 prostate cells. Also shown is a zoom in on a single peak located in the DOCK7 promoter region. (B) Shown is a heatmap illustrating the genome-wide correlation of ZFX family member binding patterns in 22Rv1 cells. (C) Bar graph of genomic distributions of ZFX family member binding sites in 22Rv1 cells in promoter and non-promoter regions (left) and bar graph showing the relative distribution of binding sites in CpG island (CGI) promoters and non-CpG island promoters (right). (D) Venn diagram comparing the sets of CpG island promoters bound by ZFX, ZFY and ZNF711 in 22Rv1 cells.
Figure 5.
Figure 5.
ZFX and ZNF711 have properties of a transcription activator when bound downstream of the TSS. (A) ZFX and ZNF711 peak sets from HEK293T cells were clustered using K-means clustering, identifying four sets of peaks with distinct binding sites (left); cluster 4 (combination peaks) was subsequently re-clustered, identifying 4 subsets (right). Tag density plots for each of the 4 different clusters are presented on top of the heatmaps. (B) Average signals of ZFX and ZNF711 ChIP-seq reads in wt HEK293T at all promoters bound by each TF (top), promoters of genes with decreased expression in all three DKO clones (middle), and promoters of genes with increased expressions in all three DKO clones (bottom). Also shown, for both the downregulated and the upregulated gene categories, is the percentage of genes whose promoters are bound by ZFX or ZNF711 in peak categories 1–4, or not bound by ZFX or ZNF711.
Figure 6.
Figure 6.
Characterization of ZFX and ZNF711 binding sites. (A) Classification of binding sites based on genomic locations of all ZFX peaks located downstream of the TSS and ZFX downstream peaks at promoters of genes down-regulated in all 3 DKO clones. (B) Classification of ZNF711 downstream ChIP-seq peaks, downstream peaks identified using read2 of the ChIP-exo dataset, and downstream peaks identified by the ChexMix program (+/-10 nt from the nt identified as the binding site by the program). (C) Tag density plots of all ZNF711 peaks from standard ChIP-seq and from ChIP-exo. (D) Motif analysis using the top 5000 peaks identified from standard ZNF711 ChIP-seq (average width 1800 nt), ChIP-exo read2 (average width 300 nt), ChIP-exo by the ChexMix program (20 nt), and randomized CpG island promoter regions (width 2 kb, 200 bp, and 20 nt). The peaks were searched for the known ZNF711 motif and the 5 nt motif identified by ChIP-exo. (E) Zoom-in comparison of peaks from ZNF711 standard ChIP-seq replicates and ChIP-exo replicates.
Figure 7.
Figure 7.
Functional analysis of the ZFX protein. (A) Schematic of FLAG-tagged ZFX zinc finger (ZF) mutant constructs. (B) Browser tracks showing genomic binding profiles of endogenous ZFX and FLAG-tagged wt ZFX and ZFX mutants in HEK293T cells. (C) Tag density plots of ChIP-seq peaks comparing endogenous ZFX and ZFX ZF9-13 peak locations in HEK293T cells. (D) Heatmaps showing ChIP-seq data from FLAG-tagged wt ZFX and ZFX ZF9-13 centered on the genomic locations of the endogenous ZFX peaks. (E) Expression levels following transfection with different ZFX constructs (as analyzed by RT-qPCR) of two genes (LONRF2 and CAPN2) whose promoters are bound by both ZFX and ZNF711 in wt HEK293T cells and which show a reduction in gene expression in all three DKO clones, of one gene (FOS) that is upregulated in all three DKO cells (a putative indirect target gene), and of one gene (HOXC4) that shows no expression changes in the DKO cells. Expression data were normalized to the control (cells transfected with an unrelated plasmid). Three independent experiments were performed using two different clonal populations of DKO cells; data points represent results from triplicate wells and duplicate PCR readings. Error bars indicate the pooled standard deviations of the means for the constructs and for the normalizing control.
Figure 8.
Figure 8.
ZFX ZF11-13 has very similar transcriptional activities as wt ZFX. (A) Volcano plots showing the differentially expressed genes (DEGs) identified via RNA-seq in comparisons of DKO cells 24 hr after transfection with FLAG-tagged wt ZFX vs. a control plasmid, FLAG-tagged ZFX ZF11-13 vs. a control plasmid, and FLAG-tagged wt ZFX vs. FLAG-tagged ZFX ZF11-13. (B) Shown is a Venn diagram comparing the 846 genes that are bound by ZFX and ZNF711 in wt HEK293T cells and show a decrease in mRNA levels in all three DKO clones and the 2275 genes that show increased levels in DKO cells transfected with either FLAG-tagged wt ZFX or ZFX ZF11-13. (C) Shown is a tag density plot of ChIP-seq data for endogenous ZFX, FLAG-tagged wt ZFX, ZFX ZF9-13, or ZFX ZF1-8 at the set of 277 responding promoters identified in panel B. (D) Motif coverage analysis of the 277 responding promoters.

Similar articles

Cited by

References

    1. Fuda N.J., Ardehali M.B., Lis J.T.. Defining mechanisms that regulate RNA polymerase II transcription in vivo. Nature. 2009; 461:186–192. - PMC - PubMed
    1. Haberle V., Stark A.. Eukaryotic core promoters and the functional basis of transcription initiation. Nat. Rev. Mol. Cell Biol. 2018; 19:621–637. - PMC - PubMed
    1. Core L., Adelman K.. Promoter-proximal pausing of RNA polymerase II: a nexus of gene regulation. Genes Dev. 2019; 33:960–982. - PMC - PubMed
    1. Vihervaara A., Duarte F.M., Lis J.T.. Molecular mechanisms driving transcriptional stress responses. Nat. Rev. Genet. 2018; 19:385–397. - PMC - PubMed
    1. Saxonov S., Berg P., Brutlag D.L.. A genome-wide analysis of CpG dinucleotides in the human genome distinguishes two distinct classes of promoters. Proc. Natl. Acad. Sci. U.S.A. 2006; 103:1412–1417. - PMC - PubMed

Publication types

Substances