

A unified dinucleotide alphabet describing both RNA and DNA structures
- PMID: 32406923
- PMCID: PMC7293047
- DOI: 10.1093/nar/gkaa383
A unified dinucleotide alphabet describing both RNA and DNA structures
Abstract
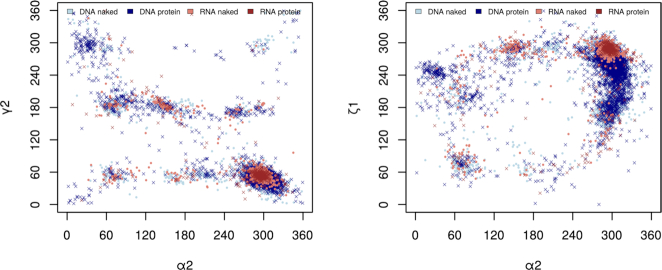
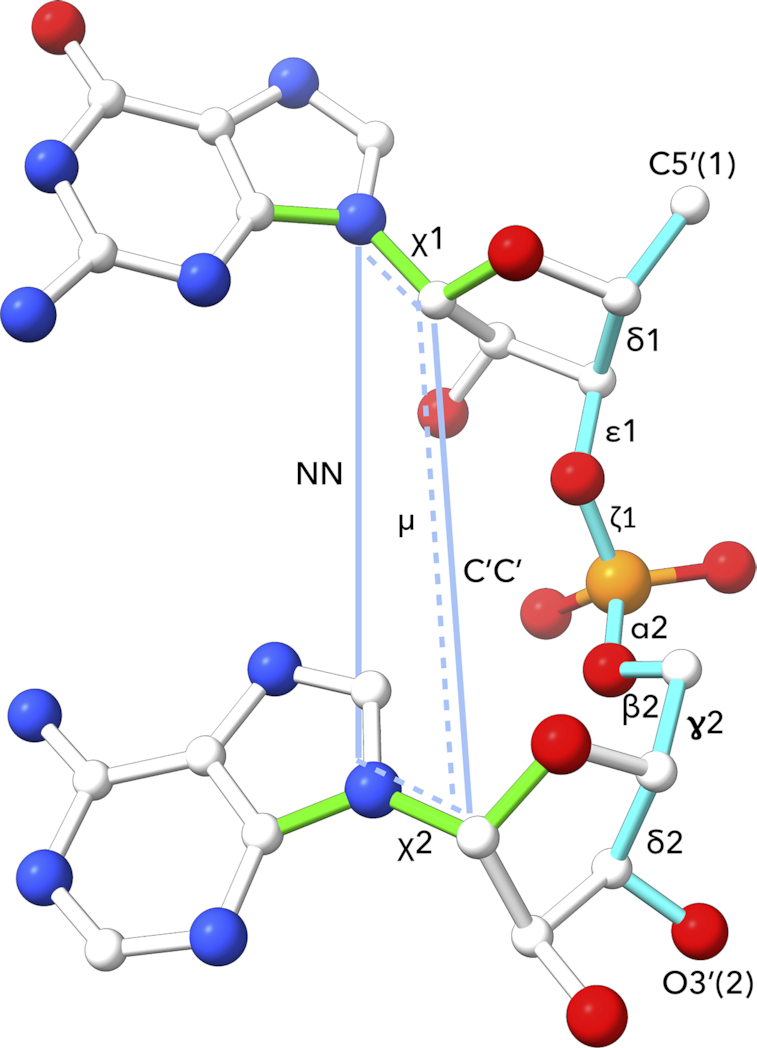
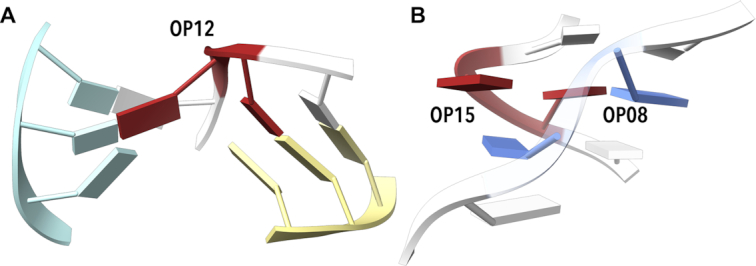
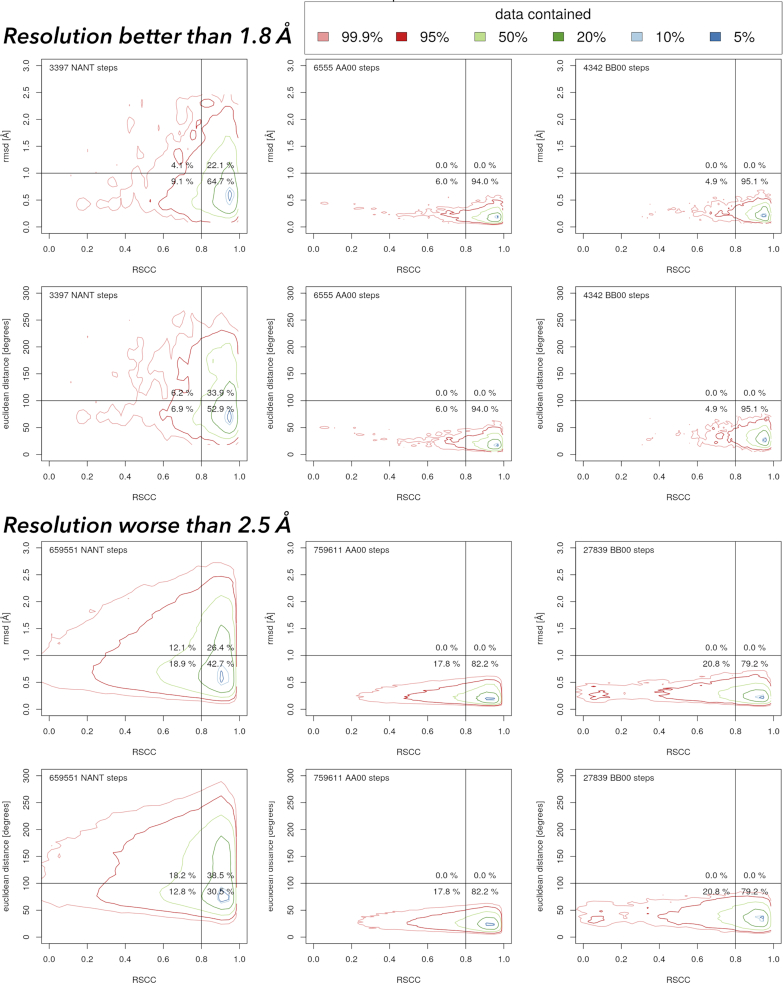
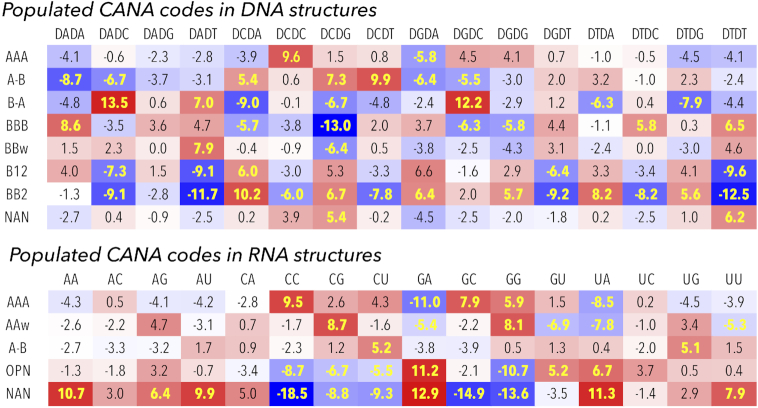
By analyzing almost 120 000 dinucleotides in over 2000 nonredundant nucleic acid crystal structures, we define 96+1 diNucleotide Conformers, NtCs, which describe the geometry of RNA and DNA dinucleotides. NtC classes are grouped into 15 codes of the structural alphabet CANA (Conformational Alphabet of Nucleic Acids) to simplify symbolic annotation of the prominent structural features of NAs and their intuitive graphical display. The search for nontrivial patterns of NtCs resulted in the identification of several types of RNA loops, some of them observed for the first time. Over 30% of the nearly six million dinucleotides in the PDB cannot be assigned to any NtC class but we demonstrate that up to a half of them can be re-refined with the help of proper refinement targets. A statistical analysis of the preferences of NtCs and CANA codes for the 16 dinucleotide sequences showed that neither the NtC class AA00, which forms the scaffold of RNA structures, nor BB00, the DNA most populated class, are sequence neutral but their distributions are significantly biased. The reported automated assignment of the NtC classes and CANA codes available at dnatco.org provides a powerful tool for unbiased analysis of nucleic acid structures by structural and molecular biologists.
© The Author(s) 2020. Published by Oxford University Press on behalf of Nucleic Acids Research.
Figures
Similar articles
-
A DNA structural alphabet provides new insight into DNA flexibility.Acta Crystallogr D Struct Biol. 2018 Jan 1;74(Pt 1):52-64. doi: 10.1107/S2059798318000050. Epub 2018 Jan 1. Acta Crystallogr D Struct Biol. 2018. PMID: 29372899 Free PMC article.
-
DNATCO: assignment of DNA conformers at dnatco.org.Nucleic Acids Res. 2016 Jul 8;44(W1):W284-7. doi: 10.1093/nar/gkw381. Epub 2016 May 5. Nucleic Acids Res. 2016. PMID: 27150812 Free PMC article.
-
Structural alphabets for conformational analysis of nucleic acids available at dnatco.datmos.org.Acta Crystallogr D Struct Biol. 2020 Sep 1;76(Pt 9):805-813. doi: 10.1107/S2059798320009389. Epub 2020 Aug 17. Acta Crystallogr D Struct Biol. 2020. PMID: 32876056 Free PMC article.
-
Role of tautomerism in RNA biochemistry.RNA. 2015 Jan;21(1):1-13. doi: 10.1261/rna.048371.114. RNA. 2015. PMID: 25516996 Free PMC article. Review.
-
Time-resolved fluorescence resonance energy transfer: a versatile tool for the analysis of nucleic acids.Biopolymers. 2001-2002;61(3):159-79. doi: 10.1002/bip.10146. Biopolymers. 2001. PMID: 11987179 Review.
Cited by
-
PTFSpot: deep co-learning on transcription factors and their binding regions attains impeccable universality in plants.Brief Bioinform. 2024 May 23;25(4):bbae324. doi: 10.1093/bib/bbae324. Brief Bioinform. 2024. PMID: 39013383 Free PMC article.
-
Has AlphaFold3 achieved success for RNA?Acta Crystallogr D Struct Biol. 2025 Feb 1;81(Pt 2):49-62. doi: 10.1107/S2059798325000592. Epub 2025 Jan 27. Acta Crystallogr D Struct Biol. 2025. PMID: 39868559 Free PMC article.
-
Revisiting DNA Sequence-Dependent Deformability in High-Resolution Structures: Effects of Flanking Base Pairs on Dinucleotide Morphology and Global Chain Configuration.Life (Basel). 2022 May 20;12(5):759. doi: 10.3390/life12050759. Life (Basel). 2022. PMID: 35629425 Free PMC article.
-
RBPSpot: Learning on appropriate contextual information for RBP binding sites discovery.iScience. 2021 Oct 30;24(12):103381. doi: 10.1016/j.isci.2021.103381. eCollection 2021 Dec 17. iScience. 2021. PMID: 34841226 Free PMC article.
-
Structural variability of CG-rich DNA 18-mers accommodating double T-T mismatches.Acta Crystallogr D Struct Biol. 2020 Dec 1;76(Pt 12):1233-1243. doi: 10.1107/S2059798320014151. Epub 2020 Nov 24. Acta Crystallogr D Struct Biol. 2020. PMID: 33263329 Free PMC article.
References
-
- Ramachandran G.N., Sasisekharan V.. Conformation of polypeptides and proteins. Adv. Protein Chem. 1968; 23:283–437. - PubMed
-
- Unger R., Harel D., Wherland S., Sussman J.L.. A 3D building blocks approach to analyzing and predicting structure of proteins. Proteins. 1989; 5:355–373. - PubMed
-
- Levitt M. Accurate modeling of protein conformation by automatic segment matching. J. Mol. Biol. 1992; 226:507–533. - PubMed
-
- Kabsch W., Sander C.. Dictionary of protein secondary structure: pattern recognition of hydrogen-bonded and geometrical features. Biopolymers. 1983; 22:2577–2637. - PubMed
Publication types
MeSH terms
Substances
LinkOut - more resources
Full Text Sources
