

An EGFR signature predicts cell line and patient sensitivity to multiple tyrosine kinase inhibitors
- PMID: 32406930
- PMCID: PMC7880578
- DOI: 10.1002/ijc.33053
An EGFR signature predicts cell line and patient sensitivity to multiple tyrosine kinase inhibitors
Abstract
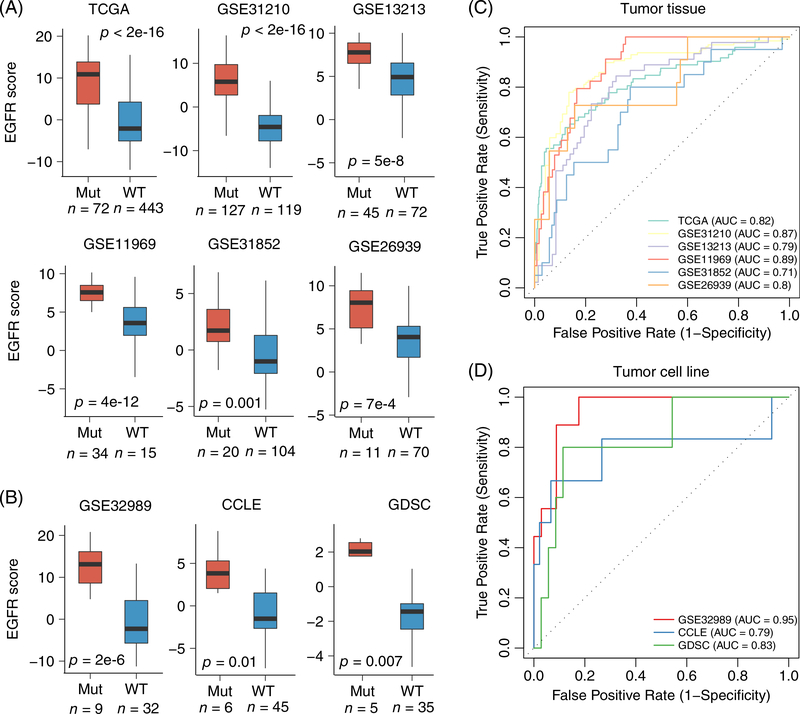
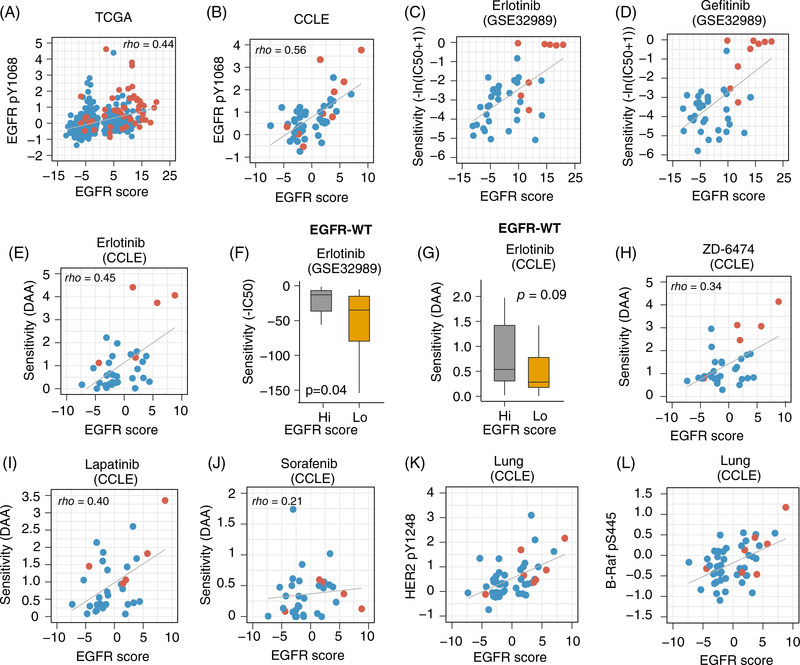
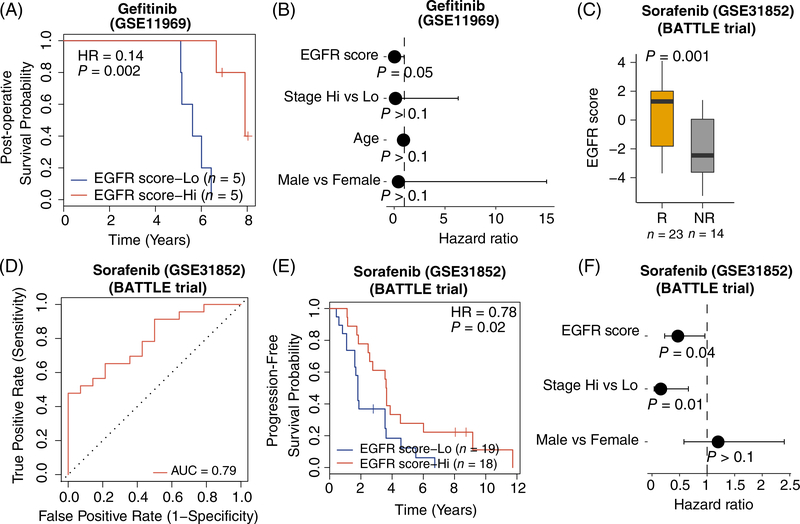
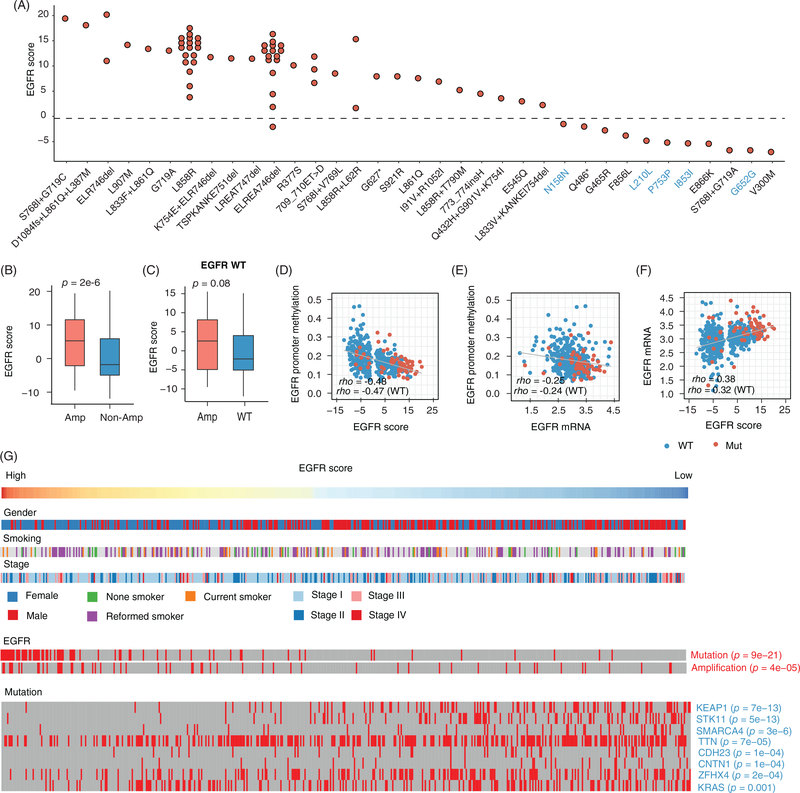
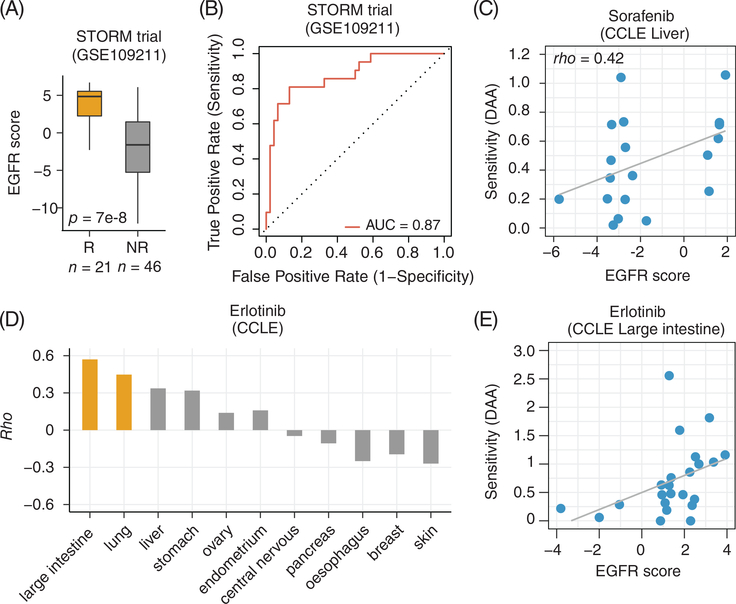
EGFR is an oncogene with a high frequency of activating mutations in nonsmall cell lung cancer (NSCLC). EGFR inhibitors have been FDA-approved for NSCLC and have shown efficacy in patients with certain EGFR mutations. However, only 9% to 26% of these patients achieve objective responses. In our study, we developed an EGFR gene signature based on The Cancer Genome Atlas (TCGA) RNA-seq data of lung adenocarcinoma (LUAD) to direct the preselection of patients for more effective EGFR-targeted therapy. This signature infers baseline EGFR signaling pathway activity (denoted as EGFR score) in tumor samples, which is associated with tumor sensitivity to EGFR inhibitors and other tyrosine kinase inhibitors (TKIs). EGFR score predicted sensitivity of lung cancer cell lines to Erlotinib, Gefitinib and Sorafenib. Importantly, EGFR score calculated from pretreated samples was associated with patient response to Gefitinib and Sorafenib in lung cancer. Additionally, integration of the EGFR signature with TCGA LUAD data showed that it accurately predicted functional effects of different somatic EGFR mutations, and identified other mutations affecting EGFR pathway activity. Finally, using cancer cell line and clinical trial data, the EGFR score was associated with patient response to TKIs in liver cancer and other cancer types. The EGFR signature provides a useful biomarker that can expand the application of EGFR inhibitors or other TKIs and improve their treatment efficacy through patient stratification.
Keywords: EGFR; EGFR-targeted therapy; biomarker; tyrosine kinase inhibitor.
© 2020 UICC.
Conflict of interest statement
CONFLICT OF INTEREST
The authors declare that they have no competing interests.
Figures
Similar articles
-
Management and future directions in non-small cell lung cancer with known activating mutations.Am Soc Clin Oncol Educ Book. 2014:e353-65. doi: 10.14694/EdBook_AM.2014.34.e353. Am Soc Clin Oncol Educ Book. 2014. PMID: 24857124 Review.
-
Clinical outcomes and secondary epidermal growth factor receptor (EGFR) T790M mutation among first-line gefitinib, erlotinib and afatinib-treated non-small cell lung cancer patients with activating EGFR mutations.Int J Cancer. 2019 Jun 1;144(11):2887-2896. doi: 10.1002/ijc.32025. Epub 2019 Jan 5. Int J Cancer. 2019. PMID: 30485437
-
Paeoniae radix overcomes resistance to EGFR-TKIs via aurora B pathway suppression in lung adenocarcinoma.Life Sci. 2024 Nov 15;357:123097. doi: 10.1016/j.lfs.2024.123097. Epub 2024 Oct 1. Life Sci. 2024. PMID: 39362582
-
PD-L1 induces autophagy and primary resistance to EGFR-TKIs in EGFR-mutant lung adenocarcinoma via the MAPK signaling pathway.Cell Death Dis. 2024 Aug 1;15(8):555. doi: 10.1038/s41419-024-06945-7. Cell Death Dis. 2024. PMID: 39090096 Free PMC article.
-
Treatment of Brain Metastases of Non-Small Cell Lung Carcinoma.Int J Mol Sci. 2021 Jan 8;22(2):593. doi: 10.3390/ijms22020593. Int J Mol Sci. 2021. PMID: 33435596 Free PMC article. Review.
Cited by
-
A lepidic gene signature predicts patient prognosis and sensitivity to immunotherapy in lung adenocarcinoma.Genome Med. 2022 Jan 12;14(1):5. doi: 10.1186/s13073-021-01010-w. Genome Med. 2022. PMID: 35016696 Free PMC article.
-
TRPV1 inhibition overcomes cisplatin resistance by blocking autophagy-mediated hyperactivation of EGFR signaling pathway.Nat Commun. 2023 May 10;14(1):2691. doi: 10.1038/s41467-023-38318-7. Nat Commun. 2023. PMID: 37165076 Free PMC article.
-
Novel prognostic signature for lung adenocarcinoma based on immune-related mRNA pairs.Heliyon. 2024 Jan 20;10(3):e24397. doi: 10.1016/j.heliyon.2024.e24397. eCollection 2024 Feb 15. Heliyon. 2024. PMID: 38317924 Free PMC article.
-
An oncogene addiction phosphorylation signature and its derived scores inform tumor responsiveness to targeted therapies.Cell Mol Life Sci. 2022 Dec 10;80(1):6. doi: 10.1007/s00018-022-04634-2. Cell Mol Life Sci. 2022. PMID: 36494469 Free PMC article.
-
Bioinformatics roadmap for therapy selection in cancer genomics.Mol Oncol. 2022 Nov;16(21):3881-3908. doi: 10.1002/1878-0261.13286. Epub 2022 Aug 20. Mol Oncol. 2022. PMID: 35811332 Free PMC article. Review.
References
-
- Inamura K, Ninomiya H, Ishikawa Y, Matsubara O. Is the epidermal growth factor receptor status in lung cancers reflected in clinicopathologic features? Arch Pathol Lab Med. 2010;134:66–72. - PubMed
-
- Lynch TJ, Bell DW, Sordella R, et al. Activating mutations in the epidermal growth factor receptor underlying responsiveness of non-small-cell lung cancer to gefitinib. N Engl J Med. 2004;350:2129–2139. - PubMed
Publication types
MeSH terms
Substances
Grants and funding
LinkOut - more resources
Full Text Sources
Other Literature Sources
Medical
Research Materials
Miscellaneous
