. 2020 Aug;598(16):3439-3457.
doi: 10.1113/JP279476. Epub 2020 Jun 18.

Modulation of cortical slow oscillatory rhythm by GABAB receptors: an in vitro experimental and computational study

Affiliations

Modulation of cortical slow oscillatory rhythm by GABAB receptors: an in vitro experimental and computational study

Maria Perez-Zabalza et al. J Physiol. 2020 Aug.

Abstract

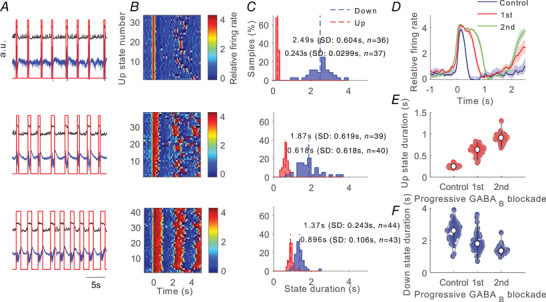
Key points: We confirm that GABAB receptors (GABAB -Rs) are involved in the termination of Up-states; their blockade consistently elongates Up-states. GABAB -Rs also modulate Down-states and the oscillatory cycle, thus having an impact on slow oscillation rhythm and its regularity. The most frequent effect of GABAB -R blockade is elongation of Down-states and subsequent decrease of oscillatory frequency, with an increased regularity. In a quarter of cases, GABAB -R blockade shortened Down-states and increased oscillatory frequency, changes that are independent of firing rates in Up-states. Our computer model provides mechanisms for the experimentally observed dynamics following blockade of GABAB -Rs, for Up/Down durations, oscillatory frequency and regularity. The time course of excitation, inhibition and adaptation can explain the observed dynamics of the network. This study brings novel insights into the role of GABAB -R-mediated slow inhibition on the slow oscillatory activity, which is considered the default activity pattern of the cortical network.

Abstract: Slow wave oscillations (SWOs) dominate cortical activity during deep sleep, anaesthesia and in some brain lesions. SWOs are composed of periods of activity (Up states) interspersed with periods of silence (Down states). The rhythmicity expressed during SWOs integrates neuronal and connectivity properties of the network and is often altered under pathological conditions. Adaptation mechanisms as well as synaptic inhibition mediated by GABAB receptors (GABAB -Rs) have been proposed as mechanisms governing the termination of Up states. The interplay between these two mechanisms is not well understood, and the role of GABAB -Rs controlling the whole cycle of the SWO has not been described. Here we contribute to its understanding by combining in vitro experiments on spontaneously active cortical slices and computational techniques. GABAB -R blockade modified the whole SWO cycle, not only elongating Up states, but also affecting the subsequent Down state duration. Furthermore, while adaptation tends to yield a rather regular behaviour, we demonstrate that GABAB -R activation desynchronizes the SWOs. Interestingly, variability changes could be accomplished in two different ways: by either shortening or lengthening the duration of Down states. Even when the most common observation following GABAB -Rs blocking is the lengthening of Down states, both changes are expressed experimentally and also in numerical simulations. Our simulations suggest that the sluggishness of GABAB -Rs to follow the excitatory fluctuations of the cortical network can explain these different network dynamics modulated by GABAB -Rs.

Keywords: Up states; cerebral cortex; computational model; inhibition; neocortical; rhythms; slow oscillations; synchronization.


Figures

Figure 1
Figure 1. Effects of progressive inhibition blockade on slow oscillations for a single recording. Example of a ‘typical’ network
A, raw signal (blue trace) and relative firing rate (black trace; see Methods). Up states were detected from the relative firing rate (red trace). From top to bottom: control (baseline) activity and two consecutive periods after application of 200 µm CGP 35348. Time scale is the same for all panels in A. For each period we analysed a single trace of 100 s. B, raster plots of the relative firing rate are represented for control activity and for 200 µm CGP 35348 corresponding to those in A. The firing rate is colour‐coded. Time scale is the same for all panels in B. C, histograms of the Up and Down duration for control activity and 200 µm CGP 35348 corresponding to those in A. Numerical values indicate the mean, standard deviation and number of Up and Down states detected in each period. D, average relative firing rate for Up states during the control and 200 µm CGP 35348 corresponding to those in A. The shadow corresponds to the SEM. E, Up state duration increases with CGP 35348. F, Down state duration increases with CGP 35348. Violin plots show the kernel density estimate of the data overlying the data points. The white point corresponds to the median value and vertical black lines joins the whisker ends.
Figure 2
Figure 2. Modulation of Up and Down states by GABAB‐Rs
A, scatter plot of the duration of Up states in control versus blockade of GABAB‐Rs with CGP 35348 (n = 37). B, same for Down state duration. In the two panels, the imaginary line is the one corresponding to the absence of changes (bisecting line). We define as ‘typical networks’ those where the Down state duration becomes elongated (empty circles) (n = 28), and ‘atypical networks’ those in which the Down states become shorter (grey‐filled circles) (n = 9).
Figure 3
Figure 3. Effects of progressive inhibition blockade on slow oscillations for a single recording; example of ‘atypical’ network
A, raw signal (blue trace), relative firing rate (black trace; see Methods) and detected Up and Down states (red trace). From top to bottom: control (baseline) activity and two consecutive periods after application of 200 µm CGP 35348. For each period we analysed a single trace of 100 s. B, raster plots of the relative firing rate are represented for control activity and for 200 µm CGP 35348 corresponding to those in A. The firing rate is colour‐coded. C, histograms of the Up and Down duration for control activity and 200 µm CGP 35348 corresponding to those in A. Numerical values indicate the mean, standard deviation and number of Up and Down states detected in each period. D, average relative firing rate for Up states during the control and 200 µm CGP 35348 corresponding to those in A. The shadow corresponds to the SEM. E, Up state duration increases with CGP 35348. F, Down state duration decreases with CGP 35348. Violin plots shows the kernel density estimate of the data overlying the data points. The white point corresponds to the median value and vertical black lines joins the whisker ends.
Figure 4
Figure 4. Effect of GABAB blockade on the variability of slow oscillations
A, ‘typical’ network. a, autocorrelograms illustrating the transformation of the emerging activity for control activity and for two consecutive periods after application of 200 µm CGP 35348 (left to right). Inset: the decay envelope of the autocorrelogram is a function of the long‐range regularity in the signal (Chatfield, 1980). b, measure of the decay envelope of the autocorrelogram. c, rhythmicity index. d, CV of Up/Down cycle, Up state duration and Down state duration. B, ‘atypical’ network. Same parameters as in A. The same particular cases of ‘typical’ and ‘atypical’ network are shown in Fig. 1 and Fig. 3 respectively.
Figure 5
Figure 5. Relative changes of Up and Down state properties after blocking GABAB‐Rs on ‘typical’ (n = 28) and ‘atypical’ (n = 9) networks
A, Kruskal–Wallis test followed by a Dunn–Bonferroni pairwise comparisons post hoc test was used to evaluate the data, < 0.05 (*); < 0.01 (**); < 0.001 (***); n.s. (not significant). Comparison between groups: < 0.05 (#); < 0.01 (##); < 0.001 (###) [Color figure can be viewed at wileyonlinelibrary.com]
Figure 6
Figure 6. Effects of elimination of layer 1; relative changes of oscillatory frequency, Up state duration and Down state duration after cutting layer 1 and CGP application (n = 11)
A, experimental sketch with double extracellular recordings. B, frequency after layer 1 was eliminated (Cut) and after layer 1 was eliminated and GABAB blockade (Cut + CGP 35348). C, Up state duration. Same states as in B. D, Down state duration. Same states as in B. A Kruskal‐Wallis test followed by a Dunn–Bonferroni pairwise comparisons post hoc test was used to compare the three situations, < 0.05 (*); < 0.01 (**); < 0.001 (***); n.s. (not significant). [Color figure can be viewed at wileyonlinelibrary.com]
Figure 7
Figure 7. Properties of the slow oscillation in a ‘typical’ and ‘atypical’ network
A, plots on the left refer to the control condition and on the right to the slice with blocked GABAB‐Rs. a, d, rastergrams. b, e, histograms of the duration of the Up (red) and Down (blue) states. Dashed lines correspond to their mean value: mean durations of Up (Down) states are 0.45 s (3.42 s) in b and 1.17 s (4.69 s) in e. c, f, spike‐train correlation functions averaged over 100 pairs of neurons. Note how the oscillation becomes more regular in the blocked condition. B, properties of the slow oscillation in an atypical network. Conventions are as in A. Mean durations of Up (Down) states are 0.36 s (3.51 s) in b and 0.73s (2.91s) in e.
Figure 8
Figure 8. Temporal traces of the synaptic and adaptation currents
Temporal traces of the population‐averaged currents for the ‘typical’ (left side) and the ‘atypical’ (right side) network. A and C, control networks; B and D, networks with the GABAB‐Rs blocked. Note the increasing regularity in the blocked case. Blue lines: total excitatory (AMPA plus NMDA) current. Red lines: total inhibitory (GABAA plus GABAB) current. Green lines: adaptation current.
Figure 9
Figure 9. Effect of NMDA conductances on the duration of Down states
A, histograms of the duration of the Down states in the control condition of a network with the same parameters as the ‘atypical’ one (Fig. 7B ) but with NMDA unitary conductances increased 40%. Average Down state duration (continuous line) is 1.1 s, 68% smaller than in the original network, 3.51 s (dashed line). B, as in A but in the blocked condition. Average Down state duration (continuous line): 1.8 s, about 33% smaller than in the original network, 2.91 s (dashed line). C, correlation function between excitatory and inhibitory currents in the ‘atypical’ network. Full line: correlation function between total excitatory and inhibitory currents in the control condition. Dashed line: as before but in the GABAB‐blocked condition. Dashed‐dotted line: correlation function between total excitation and GABAB component of the inhibition. CF, correlation function.

Comment in

References

    1. Aghajanian GK & Rasmussen K (1989). Intracellular studies in the facial nucleus illustrating a simple new method for obtaining viable motoneurons in adult rat brain slices. Synapse 3, 331–338. - PubMed
    1. Aserinsky E & Kleitman N (1953). Regularly occurring periods of eye motility, and concomitant phenomena, during sleep. Science 118, 273–274. - PubMed
    1. Benita JM, Guillamon A, Deco G & Sanchez‐Vives MV (2012). Synaptic depression and slow oscillatory activity in a biophysical network model of the cerebral cortex. Front Comput Neurosci 6, 64. - PMC - PubMed
    1. Bettinardi RG, Tort‐Colet N, Ruiz‐Mejias M, Sanchez‐Vives MV & Deco G (2015). Gradual emergence of spontaneous correlated brain activity during fading of general anesthesia in rats: evidences from fMRI and local field potentials. Neuroimage 114, 185–198. - PMC - PubMed
    1. Bullock TH & McClune MC (1989). Lateral coherence of the electrocorticogram: a new measure of brain synchrony. Bullock, TH , In How do Brains Work?, pp. 375–396. Birkhäuser, Boston. Available at: https://doi.org/10.1007%2F978‐1‐4684‐9427‐3_33.

Publication types