

Endoplasmic reticulum stress actively suppresses hepatic molecular identity in damaged liver
- PMID: 32407006
- PMCID: PMC7224309
- DOI: 10.15252/msb.20199156
Endoplasmic reticulum stress actively suppresses hepatic molecular identity in damaged liver
Abstract
Liver injury triggers adaptive remodeling of the hepatic transcriptome for repair/regeneration. We demonstrate that this involves particularly profound transcriptomic alterations where acute induction of genes involved in handling of endoplasmic reticulum stress (ERS) is accompanied by partial hepatic dedifferentiation. Importantly, widespread hepatic gene downregulation could not simply be ascribed to cofactor squelching secondary to ERS gene induction, but rather involves a combination of active repressive mechanisms. ERS acts through inhibition of the liver-identity (LIVER-ID) transcription factor (TF) network, initiated by rapid LIVER-ID TF protein loss. In addition, induction of the transcriptional repressor NFIL3 further contributes to LIVER-ID gene repression. Alteration to the liver TF repertoire translates into compromised activity of regulatory regions characterized by the densest co-recruitment of LIVER-ID TFs and decommissioning of BRD4 super-enhancers driving hepatic identity. While transient repression of the hepatic molecular identity is an intrinsic part of liver repair, sustained disequilibrium between the ERS and LIVER-ID transcriptional programs is linked to liver dysfunction as shown using mouse models of acute liver injury and livers from deceased human septic patients.
Keywords: NFIL3; PAR-bZIP; liver injury; sepsis; super-enhancer.
©2020 The Authors. Published under the terms of the CC BY 4.0 license.
Conflict of interest statement
BS is consultant for Genfit SA. The remaining authors declare no competing financial interest.
Figures
- A
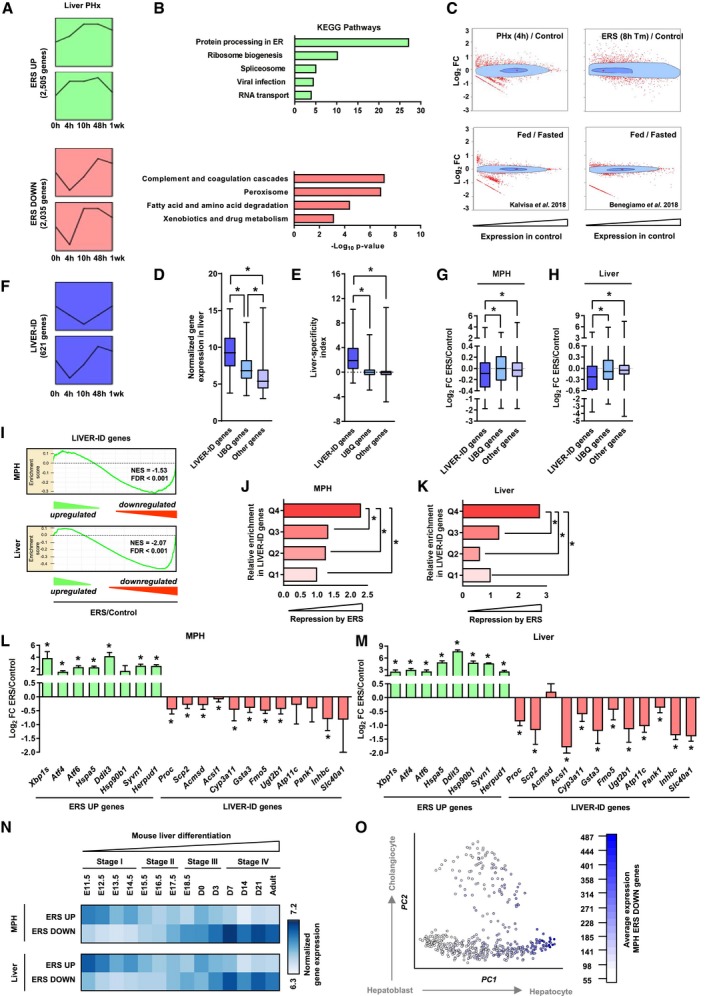
Top 2 significantly overrepresented expression patterns for ERS UP and ERS DOWN genes following PHx. Data show changes in the expression at 4, 10, 48 h, and 1 week after PHx (0 h) for genes comprised within each model profile of dynamic expression identified by STEM. The complete set of identified model profiles is provided in Appendix Fig S2.
- B
Functional enrichment analyses were performed using ERS UP (upper panels) or ERS DOWN (lower panels) genes and the ToppGene Suite. KEGG Pathways with Bonferroni‐corrected P < 10−3 were considered, and similar terms were merged.
- C
Bagplots showing the breadth of transcriptomic changes for the indicated datasets. Genes were positioned based on their basal expression levels in the control conditions and their FC (Log2) in the indicated (patho)physiological context. The dark blue area is the “bag” (50% of the data points around the median, which is indicated by a red cross), while the light blue area delimits the “loop” (see Materials and Methods for details). Red dots are outliers.
- D, E
Box plots showing normalized expression in liver (D) and liver‐specificity index (E) of LIVER‐ID genes, UBQ genes, and other genes. Liver‐specificity index was calculated as the difference in normalized expression in liver (2 replicates) and mean of normalized expression in control tissues (2 replicates per tissue) using data from BioGPS (Table EV6) and is reported as Log2. Box plots are composed of a box from the 25th to the 75th percentile with the median as a line and min to max as whiskers. One‐way ANOVA with Welch's correction and Dunnett's modified Tukey–Kramer pairwise multiple comparison test was used to assess statistical significance, *P < 0.05.
- F
Similar analyses as in (A) using LIVER‐ID genes.
- G, H
Box plots showing Log2 FC ERS/control in MPH (3 independent experiments) (G) or mouse liver (3 mice per group) (H) for LIVER‐ID genes, UBQ genes, and other genes. Box plots are composed of a box from the 25th to the 75th percentile with the median as a line and min to max as whiskers. One‐way ANOVA with Welch's correction and Dunnett's modified Tukey–Kramer pairwise multiple comparison test was used to assess statistical significance, *P < 0.05.
- I
Enrichment plots from gene set enrichment analyses (GSEA) performed using LIVER‐ID genes as the gene set and transcriptomic changes induced by acute ERS in MPH (upper panel) or mouse liver (lower panel) as the ranked gene list. NES and FDR (as in all subsequent GSEA panels) are the normalized enrichment score and the false discovery rate provided by the GSEA software, respectively.
- J, K
Genes repressed by ERS in MPH (3 independent experiments) (J) or mouse liver (3 mice per group) (K) were ranked based on their Log2 FC ERS/control and divided into quartiles (increased repression from Q1 to Q4). The fraction of LIVER‐ID genes in the 4 quartiles was defined and is displayed relative to that obtained for Q1 arbitrarily set to 1. Chi‐square test with BH correction for multiple testing was used to assess statistical significance, *P < 0.05.
- L, M
RT–qPCR analyses of selected ERS UP and LIVER‐ID genes monitoring expression changes induced by acute ERS in MPH (3–9 independent experiments) (L) or mouse liver (5–7 mice per group) (M). The bar graphs show means ± SD (standard deviations). One‐sample t‐test with BH correction for multiple testing was used to determine whether the mean Log2 FC ERS/control is statistically different from 0, *P < 0.05. Panel (L) is also displayed in Appendix Fig S3G.
- N
Heatmaps showing normalized expression of ERS UP and ERS DOWN genes from MPH (upper panel) or mouse liver (lower panel) in mouse liver at the indicated stages of development.
- O
Average expression of ERS DOWN genes from MPH in single cells from the hepatobiliary lineage. See Materials and Methods together with Appendix Fig S3I for details regarding data processing. The hepatoblast‐to‐hepatocyte and hepatoblast‐to‐cholangiocyte differentiation paths are indicated with arrows.
- A
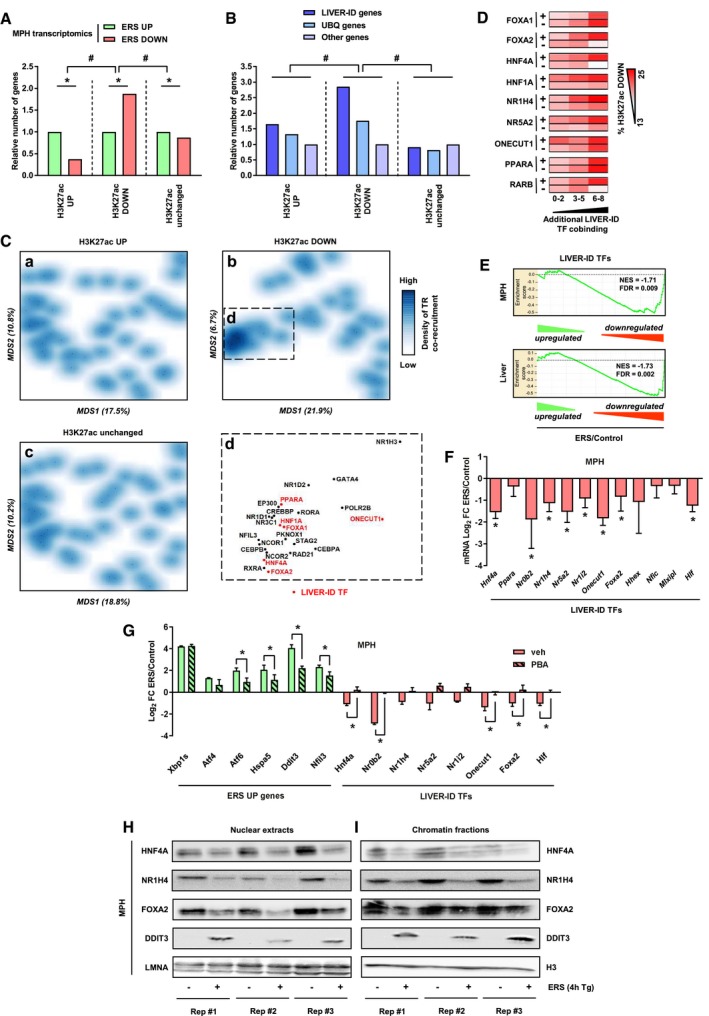
Comparison of transcriptomics (data from three independent experiments) and H3K27ac ChIP‐seq (data from three independent experiments) from MPH. Genes were assigned to H3K27ac regions as described in Materials and Methods. The number of ERS DOWN genes is indicated relative to the number of ERS UP genes for the three categories of H3K27ac regions. Fisher's exact test with BH correction for multiple testing was used to assess statistical significance, *P < 0.05, # P < 0.05.
- B
Similar analyses to (A). The number of LIVER‐ID and UBQ genes is indicated relative to the number of other genes for the three categories of H3K27ac regions. The H3K27ac ChIP‐seq data were obtained from three independent MPH experiments. Chi‐square test with BH correction for multiple testing was used to assess statistical significance, # P < 0.05.
- C
Multidimensional scaling (MDS) was performed as described in Materials and Methods, and transcriptional regulator co‐recruitment was depicted using density plots for regions with increased (a), decreased (b) or unchanged (c) H3K27ac levels in MPH upon acute ERS. The boxed area (d) represents a subset of transcriptional regulators (TR) with a high degree of co‐binding in H3K27ac DOWN regions. LIVER‐ID TFs are depicted in red.
- D
Heatmaps showing the percentage of enhancers overlapping H3K27ac down regions. Enhancers were first split into those bound or not by a given LIVER‐ID TF (right) and then based on co‐binding of additional LIVER‐ID TFs (defining three subgroups with 0–2, 3–5, or 6–8 co‐bound additional LIVER‐ID TFs).
- E
Enrichment plots from GSEA performed using LIVER‐ID TFs as the gene set and transcriptomic changes induced by acute ERS in MPH (upper panel) or mouse liver (lower panel) as the ranked gene list.
- F
RT–qPCR analyses of selected LIVER‐ID TFs monitoring expression changes induced by acute ERS in MPH (4 to 7 independent experiments). The bar graph shows means ± SD (standard deviations). One‐sample t‐test with BH correction for multiple testing was used to determine whether the mean Log2 FC ERS/control is statistically different from 0, *P < 0.05. This graph is also displayed in Appendix Fig S6E.
- G
RT–qPCR analyses of selected ERS UP and LIVER‐ID TF genes monitoring expression changes induced by 4 h ERS in MPH pre‐treated or not for 30 min with 5 mM PBA (three independent experiments). Mean Log2 FC ERS/control is shown. The bar graph shows means ± SD (standard deviations). Two‐way ANOVA with Bonferroni's post hoc test was used to assess statistical significance, *P < 0.05.
- H, I
Nuclear extracts (H) and chromatin fractions (I) from MPH were subjected to Western blot with antibodies against HNF4A, NR1H4/FXR, FOXA2/HNF3B, or DDIT3/CHOP. LMNA or histone H3 was used as loading control. Results obtained from 3 independent biological replicates are shown. See Appendix Fig S6H and Ploton et al (2018) for antibody validation.
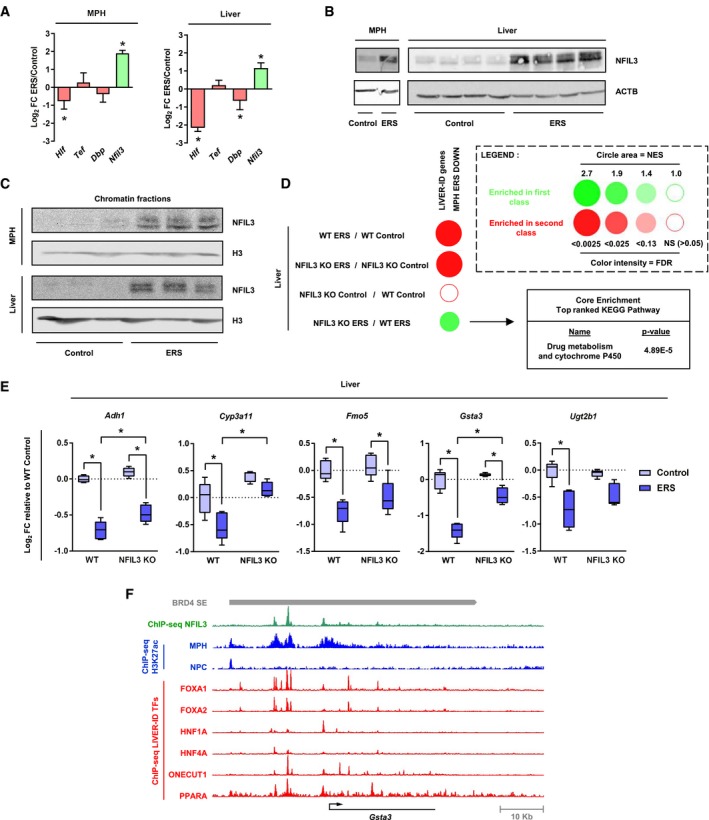
RT–qPCR analyses of Hlf, Tef, Dbp, and Nfil3 expression monitoring changes induced by acute ERS in MPH (3–5 independent experiments) (left panel) or mouse liver (five mice per group) (right panel). The bar graphs show means ± SD (standard deviations). One‐sample t‐test with BH correction for multiple testing was used to determine whether the mean Log2 FC ERS/control is statistically different from 0, *P < 0.05.
Total protein extracts from MPH (left panel) or mouse liver (right panel) were subjected to Western blot with an antibody against NFIL3. ACTB was used as loading control. See Appendix Fig S7B for antibody validation.
Chromatin fractions from MPH (upper panel) or mouse liver (lower panel) were subjected to Western blot with an antibody against NFIL3. Histone H3 was used as loading control.
Enrichment scores from GSEA performed using LIVER‐ID genes repressed by acute ERS in MPH (MPH ERS DOWN) as the gene set and liver transcriptomic changes induced by acute ERS and/or deletion of Nfil3 (NFIL3 KO) as the ranked gene lists were integrated and corrected for multiple testing using the BubbleGUM tool. For the NFIL3 KO ERS vs WT ERS comparison, the Core Enrichment genes (i.e., the subset of genes that contributes most to the enrichment result) were subjected to functional enrichment analyses using the ToppGene Suite. The top ranked KEGG Pathway with its Bonferroni‐corrected P‐value is shown.
Box plots showing mRNA expression for 5 genes from the Core Enrichment from D involved in xenobiotic metabolism issued from the transcriptomic analyses. Shown are Log2 FC relative to the mean normalized expression in the WT control group (five mice per group). Box plots are composed of a box from the 25th to the 75th percentile with the median as a line and min to max as whiskers. Two‐way ANOVA with Bonferroni's post hoc test was used to assess statistical significance, *P < 0.05.
The Integrated Genome Browser (IGB) was used to visualize ChIP‐seq profiles for NFIL3 (green) and several LIVER‐ID TFs (red) in the mouse liver at the Gsta3 gene locus. Levels of H3K27ac in MPH and cells from the non‐parenchymal fraction (NPC) are shown in blue. The grey bar indicates the position of a BRD4 SE.
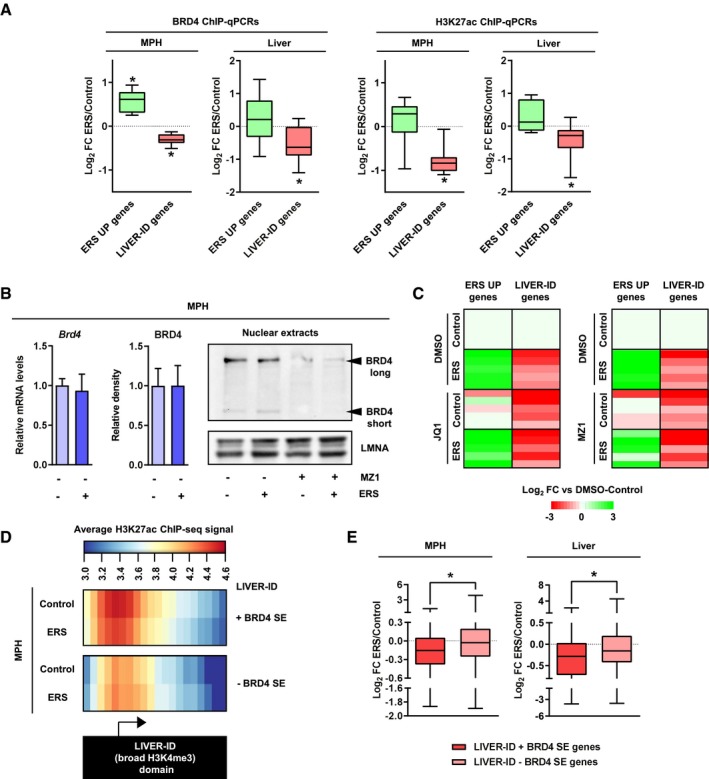
BRD4 occupancy (left panels) and H3K27ac levels (right panels) at regulatory regions associated with ERS UP or LIVER‐ID genes (8 regions at ERS gene loci and 10 regions at LIVER‐ID gene loci, depicted in Appendix Fig S10B and listed in Table EV5) were assessed by ChIP‐qPCR in MPH (10 independent experiments) or mouse liver (10 mice per group) to define changes induced by acute ERS. Box plots are composed of a box from the 25th to the 75th percentile with the median as a line and min to max as whiskers. One‐sample t‐test with BH correction for multiple testing was used to determine whether the mean Log2 FC ERS/control is statistically different from 0, *P < 0.05.
Left panel, BRD4 mRNA (4 independent experiments) or protein expression levels (5 independent experiments; densitometric quantification of Fig 4B and Appendix Fig S10C) in MPH subjected to acute ERS. The bar graphs show means ± SD (standard deviations). Student's t‐test was used to assess statistical significance. Right panel, Total protein extracts from MPH pre‐treated for 3 h with 0.01 μM MZ1 followed by addition of 1 μM thapsigargin (ERS) for 4 h were subjected to Western blot with an antibody against the N‐terminus of BRD4 (Wu et al, 2006). LMNA was used as loading control.
Heatmaps showing Log2 FC (relative to the DMSO‐control condition) for 5 ERS UP and LIVER‐ID genes issued from RT–qPCR analyses (Appendix Fig S11) of MPH pre‐treated with 500 nM JQ1 (left) or 0.01 μM MZ1 (right) followed by addition of 1 μM thapsigargin (ERS) for 4 h (3–6 independent experiments). Two‐way ANOVA with Bonferroni's post hoc test was used to assess statistical significance.
Heatmaps showing average H3K27ac ChIP‐seq signals in MPH at LIVER‐ID domains overlapping (+) or not (‐) with BRD4 SE. The arrow indicates the position of gene transcriptional start sites.
Box plots showing Log2 FC ERS/control in MPH (three independent experiments) (left panel) or mouse liver (three mice per group) (right panel) for genes associated with LIVER‐ID + BRD4 SE or LIVER‐ID ‐ BRD4 SE, which are listed in Table EV1. Box plots are composed of a box from the 25th to the 75th percentile with the median as a line and min to max as whiskers. Student's t‐test was used to assess statistical significance, *P < 0.05.
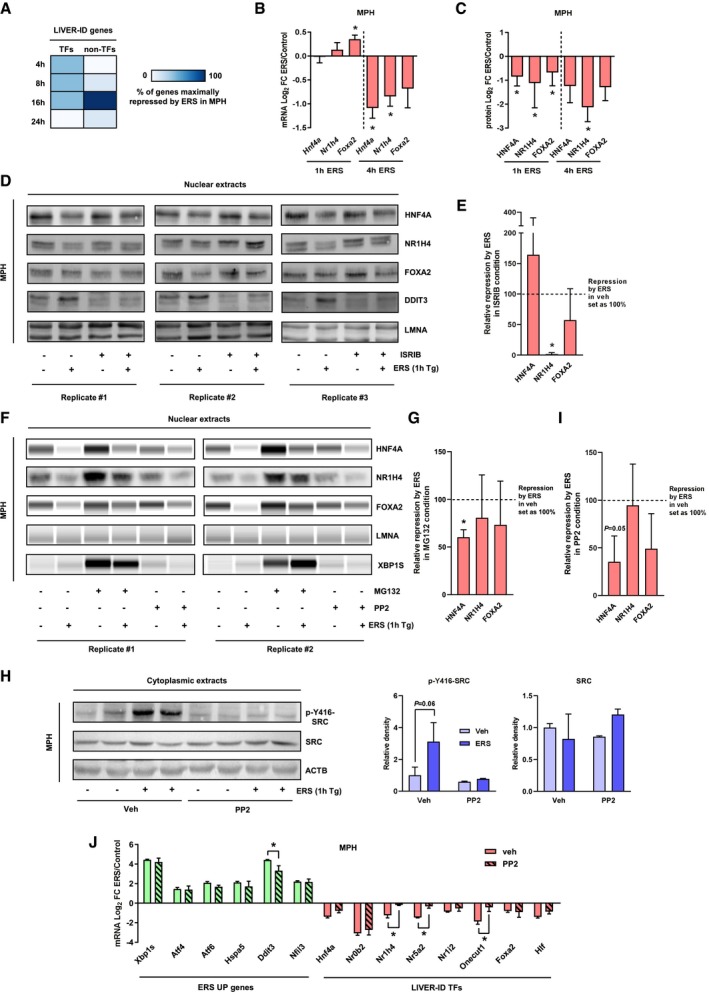
RT–qPCR analyses of 21 LIVER‐ID genes (12 TFs and 9 non‐TFs, listed in Table EV5) in MPH which were treated with 1 μM thapsigargin (ERS) for 4, 8, 16, or 24 h (four independent experiments). For each gene, the timepoint showing maximal repression by ERS was recorded. The heatmap depicts the percentage of genes maximally repressed by ERS at each timepoint.
RT–qPCR analyses of Hnf4a, Nr1h4, and Foxa2 expression in MPH treated with vehicle (control) or 1 μM thapsigargin (ERS) for 1 or 4 h (four independent experiments). The bar graph shows means ± SD (standard deviations). One‐sample t‐test with BH correction for multiple testing was used to determine whether the mean Log2 FC ERS/control is statistically different from 0, *P < 0.05.
Densitometric quantification of the protein expression data shown in Figs 5D and 5F, Appendix Fig S18A and B for the 1‐h timepoint (average of 9 biological replicates) and Fig 2H for the 4‐h timepoint (average of 3 biological replicates). The bar graph shows means ± SD (standard deviations). One‐sample t‐test with BH correction for multiple testing was used to determine whether the mean Log2 FC ERS/control is statistically different from 0, *P < 0.05.
Nuclear extracts from MPH pre‐treated for 30 min with 1 μM ISRIB followed by addition of 1 μM thapsigargin (ERS) for 1 h were subjected to Western blot with antibodies against HNF4A, NR1H4, FOXA2, or DDIT3. LMNA was used as loading control. Results obtained from three independent biological replicates are shown.
Densitometric quantification of the protein expression data shown in panel (D). Repression by ERS in the ISRIB condition (average of three biological replicates) is shown relative to repression by ERS in vehicle condition. The bar graph shows means ± SD (standard deviations). One‐sample t‐test with BH correction for multiple testing was used to determine whether the mean relative repression is statistically different from 100%, *P < 0.05.
Nuclear extracts from MPH pre‐treated for 30 min with 10 μM MG132 or 10 μM PP2 followed by addition of 1 μM thapsigargin (ERS) for 1 h were subjected to Western blot or Simple Western immunoassay with antibodies against HNF4A, NR1H4, FOXA2, or XBP1S. LMNA was used as loading control. Results obtained from 2 independent biological replicates are shown. Additional replicates are shown in Appendix Fig S18A and B.
Densitometric quantification of the protein expression data shown in panel (F) and Appendix Fig S18A. Repression by ERS in MG132 condition (average of 4 biological replicates) is shown relative to repression by ERS in vehicle condition. The bar graph shows means ± SD (standard deviations). One‐sample t‐test with BH correction for multiple testing was used to determine whether the mean relative repression is statistically different from 100%, *P < 0.05.
(Left) Cytoplasmic extracts issued from the MPH used in panel (F) (2 biological replicates) were subjected to Western blot with antibodies against P‐Y416‐SRC or total SRC. ACTB was used as loading control. (Right) Densitometric quantification of the protein expression data. The bar graphs show means ± SD (standard deviations). Two‐way ANOVA with Bonferroni's post‐hoc test was used to assess statistical significance.
Densitometric quantification of the protein expression data shown in panel (F) and Appendix Fig S18B. Repression by ERS in the PP2 condition (average of four biological replicates) is shown relative to repression by ERS in vehicle condition. The bar graph shows means ± SD (standard deviations). One‐sample t‐test with BH correction for multiple testing was used to determine whether the mean relative repression is statistically different from 100%.
RT–qPCR analyses of selected ERS UP and LIVER‐ID TF genes monitoring expression changes induced by 4‐h ERS in MPH pre‐treated or not for 30 min with 10 μM PP2 (3 independent experiments). Mean Log2 FC ERS/control is shown. The bar graph shows means ± SD (standard deviations). Two‐way ANOVA with Bonferroni's post hoc test was used to assess statistical significance, *P < 0.05.
- A
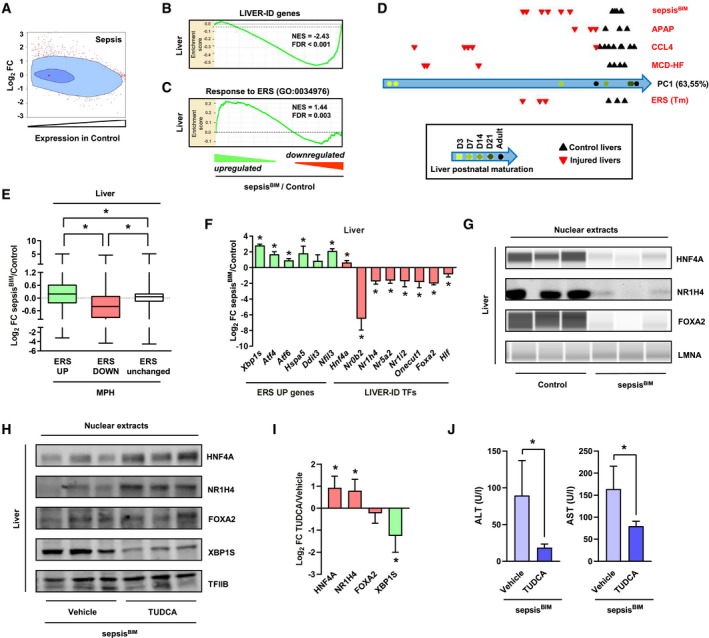
Similar analysis as in Fig 1C using transcriptomic data from the liver of sepsisBIM mice (16 h after intraperitoneal injection of live E. coli).
- B, C
Enrichment plots from GSEA performed using LIVER‐ID genes (B) or the response to ERS gene set (GO:0034976) (C) as the gene set and transcriptomic differences in sepsisBIM vs control mouse liver as the ranked gene list.
- D
Comparison of the transcriptome of the indicated liver injury models (details are provided in Appendix Fig S20 and Table EV6) with that of the developing mouse liver performed as described in the Materials and Methods. PC1 is the first principal component which represents 63.55% of the variability within the mouse liver differentiation study. PC1 was used to project the liver injury studies. APAP, acetaminophen overdose—model of drug‐induced acute liver injury. CCL4, carbon tetrachloride hepatotoxicity—model of drug‐induced chronic liver injury. MCD‐HF, methionine–choline‐deficient diet with high fat—model of NASH/fibrosis.
- E
Box plots showing Log2 FC for ERS UP, DOWN, or unchanged genes in sepsisBIM vs control mouse liver (6 mice per group). Box plots are composed of a box from the 25th to the 75th percentile with the median as a line and min to max as whiskers. One‐way ANOVA with Welch's correction and Dunnett's modified Tukey–Kramer pairwise multiple comparison test was used to assess statistical significance, *P < 0.05.
- F
RT–qPCR analyses of selected ERS UP genes and LIVER‐ID TFs monitoring expression changes in the liver of sepsisBIM vs control mice (6 mice per group). The bar graph shows means ± SD (standard deviations). One‐sample t‐test with BH correction for multiple testing was used to determine whether the mean Log2 FC sepsisBIM/control is statistically different from 0, *P < 0.05.
- G
Nuclear extracts from livers of control or sepsisBIM mice were subjected to Western blot or Simple Western immunoassay with antibodies against HNF4A, NR1H4, or FOXA2. LMNA was used as loading control.
- H
Nuclear extracts from livers of sepsisBIM mice pre‐treated for 4 consecutive days with vehicle or 500 mpk TUDCA were subjected to Western blot with antibodies against HNF4A, NR1H4, FOXA2, or XBP1S. TFIIB was used as loading control. Additional mice are shown in Appendix Fig S22D.
- I
Densitometric quantification of the protein expression data from 6 mice per condition shown in panel (H) (3 mice per condition) and Appendix Fig S22D (3 additional independent mice per condition). The bar graph shows means ± SD (standard deviations). One‐sample t‐test with BH correction for multiple testing was used to determine whether the mean Log2 FC TUDCA/Vehicle is statistically different from 0, *P < 0.05.
- J
Serum alanine aminotransferase (ALT) (left) and aspartate aminotransferase (AST) activities (right) from sepsisBIM mice pre‐treated for 4 consecutive days with vehicle or 500 mpk TUDCA (10 mice per group). The bar graphs show means ± SD (standard deviations). Student's t‐test was used to assess statistical significance, *P < 0.05.
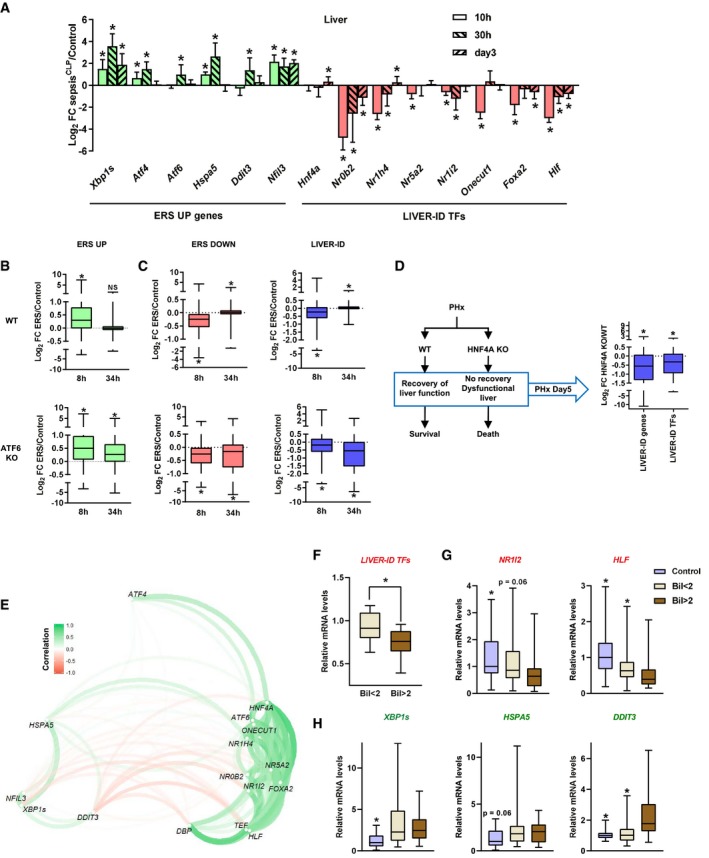
RT–qPCR analyses of selected ERS UP genes and LIVER‐ID TFs in livers from sepsisCLP mice collected 10, 30 h, or 3 days after CLP (15 mice per group) vs livers from healthy pair‐fed mice (control) (15 mice per group). The bar graph shows means ± SD (standard deviations). Wilcoxon test with BH correction for multiple testing was used to assess statistical significance, *P < 0.05.
Box plots showing Log2 FC ERS/control in mouse liver for ERS UP genes 8 and 34 h after tunicamycin injection in WT or ATF6 KO mice (3 mice per experimental condition). Box plots are composed of a box from the 25th to the 75th percentile with the median as a line and min to max as whiskers. One‐sample t‐test with BH correction for multiple testing was used to determine whether the mean Log2 FC ERS/control is statistically different from 0, *P < 0.05. NS, not significant.
Similar analyses to panel (B) for ERS DOWN and LIVER‐ID genes (3 mice per experimental condition). Box plots are composed of a box from the 25th to the 75th percentile with the median as a line and min to max as whiskers. One‐sample t‐test with BH correction for multiple testing was used to determine whether the mean Log2 FC ERS/control is statistically different from 0, *P < 0.05.
Main observations from Huck et al (2019) (left) and box plots showing Log2 FC HNF4A KO/control in mouse liver (three mice per group) for LIVER‐ID genes and TFs 5 days after PHx (right). Box plots are composed of a box from the 25th to the 75th percentile with the median as a line and min to max as whiskers. One‐sample t‐test with BH correction for multiple testing was used to determine whether the mean Log2 FC HNF4A KO/control is statistically different from 0, *P < 0.05.
Correlations of gene expressions within the critically ill group were used to organize the analyzed genes as a network. Green bars indicate a positive correlation, while red bars indicate a negative correlation. The color intensity is proportional to the correlation coefficient. The position of the genes is determined by both the directions and values of the correlation coefficients.
Expression of LIVER‐ID TF encoding genes from Appendix Fig S23A was analyzed in the livers of deceased critically ill patients with sepsis displaying agonal bilirubin levels below (Bil < 2; n = 34) or above (Bil > 2; n = 28) 2 mg/dl. Median fold change expression level of each group for the different genes has been used to generate the box plots. Expression levels in the critically ill groups are expressed relative to those in the control group (n = 18). Box plots are composed of a box from the 25th to the 75th percentile with the median as a line and min to max as whiskers. One‐tailed t‐test was used to assess whether expression of LIVER‐ID TF encoding genes in the Bil > 2 group is significantly greater than in the Bil < 2 group, *P < 0.05.
RT–qPCR analyses of indicated LIVER‐ID TF encoding genes monitoring expression in the livers of Bil < 2 (n = 34) or Bil > 2 (n = 28) groups of deceased critically ill patients with sepsis vs control donors (n = 18). Data are shown as box plots, with mRNA levels of the critically ill groups expressed relative to those of the control group. Box plots are composed of a box from the 25th to the 75th percentile with the median as a line and min to max as whiskers. Wilcoxon test was used to assess statistically significant differences with the Bil > 2 group, *P < 0.05.
RT–qPCR analyses of indicated ERS UP genes performed and analyzed as in panel (G). Box plots are composed of a box from the 25th to the 75th percentile with the median as a line and min to max as whiskers. Wilcoxon test was used to assess statistically significant differences with the Bil > 2 group, *P < 0.05.
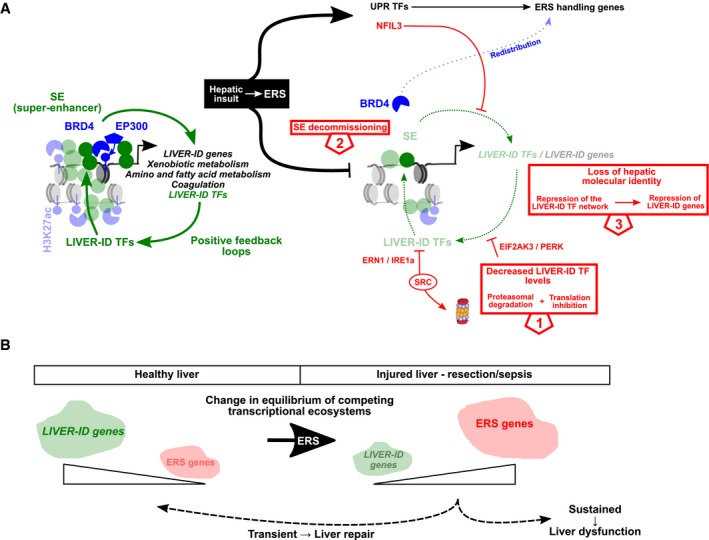
Model for ERS‐mediated loss of hepatic identity. Initial loss in LIVER‐ID TF activities involves reduced protein levels linked to PERK and SRC signaling ❶, which is secondarily amplified by decommissioning of BRD4 SE ❷ and impaired feedback loops within the LIVER‐ID TF hepatic network ❸. This consequently leads to loss of hepatic molecular identity and partial dedifferentiation of hepatocytes ❸. Induction of NFIL3 operates as an additional mechanism further contributing to active repression of the LIVER‐ID TF network target genes, especially those involved in xenobiotic metabolism.
Implications of the competitive equilibrium between the hepatic and ERS transcriptional programs in liver pathophysiology. Please also refer to the discussion.
References
Publication types
MeSH terms
Substances
Associated data
- Actions
- Actions
Grants and funding
LinkOut - more resources
Full Text Sources
Medical
Molecular Biology Databases
Miscellaneous
