. 2020 Aug 3;130(8):4133-4151.
doi: 10.1172/JCI130324.

Maternal diesel particle exposure promotes offspring asthma through NK cell-derived granzyme B

Affiliations

Maternal diesel particle exposure promotes offspring asthma through NK cell-derived granzyme B

Qian Qian et al. J Clin Invest. .

Abstract

Mothers living near high-traffic roads before or during pregnancy are more likely to have children with asthma. Mechanisms are unknown. Using a mouse model, here we showed that maternal exposure to diesel exhaust particles (DEP) predisposed offspring to allergic airway disease (AAD, murine counterpart of human asthma) through programming of their NK cells; predisposition to AAD did not develop in DEP pups that lacked NK cells and was induced in normal pups receiving NK cells from WT DEP pups. DEP NK cells expressed GATA3 and cosecreted IL-13 and the killer protease granzyme B in response to allergen challenge. Extracellular granzyme B did not kill, but instead stimulated protease-activated receptor 2 (PAR2) to cooperate with IL-13 in the induction of IL-25 in airway epithelial cells. Through loss-of-function and reconstitution experiments in pups, we showed that NK cells and granzyme B were required for IL-25 induction and activation of the type 2 immune response and that IL-25 mediated NK cell effects on type 2 response and AAD. Finally, experiments using human cord blood and airway epithelial cells suggested that DEP might induce an identical pathway in humans. Collectively, we describe an NK cell-dependent endotype of AAD that emerged in early life as a result of maternal exposure to DEP.

Keywords: Asthma; Immunology; Mouse models; NK cells; Pulmonology.


Conflict of interest statement

Conflict of interest: EV is a cofounder and employee of Innate Pharma.

Figures

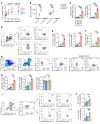
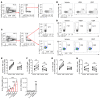
Figure 1
Figure 1. Maternal exposure to DEP enhances type 2 immune response and AAD in offspring.
(AJ) AAD and type 2 immune response in lungs of PBS-PBS, DEP-PBS, PBS-OVA, and DEP-OVA pups. (A) Total lung resistance to methacholine in indicated groups of pups. n = 6. Rrs, resistance of the respiratory system. (B) Leukocyte subsets in BAL fluid. n = 6. (C) Peribronchial inflammation scores (left) and proportions of bronchial epithelial (epi) areas that are PAS (mucin)+ (right). n = 6. (D) Flow cytometry (FC) plots to quantify pulmonary IL-5+ and IL-13+ CD4+ T cells. PMA/ionomycin-stimulated lung cell suspensions were stained for flow cytometry. After ex vivo stimulation with PMA/Ionomycin, staining, exclusion of debris, doublets, and dead cells, live (eFluor506) lung singlets were gated on CD3+CD4+ cells and then on cytokine+ cells. (E) Percentages of cytokine+ CD4+ T cells in live lung cells. n = 6. (F) OVA-specific IgE in serum. n = 9. (G) FC plots to quantify lung ILC2 subsets. Live lung singlets (no ex vivo stimulation) were analyzed for Lineage/Lin markers (CD3, B220, CD11b, CD11c, Gr1, FcεRIα, and NK1.1) and CD45. CD45+Lin cells were analyzed for CD127. CD127+ cells were analyzed for IL25R and ST2 to quantify IL25R+ST2, IL25R+ST2+, and IL25RST2+ ILC2 subsets (CD45+LinCD127+IL25R+ST2, CD45+LinCD127+IL25R+ST2+, and CD45+LinCD127+IL25RST2+ cells, respectively). (H) Percentages of ILC2 subsets in live lung cells. n = 6. (I) Gating strategy to quantify pulmonary cytokine+ ILC2s. PMA/ionomycin-stimulated live singlets were gated on CD45+Lin cells, then on CD127+ cells and finally on cytokine+ cells. (J) Percentages of cytokine+ ILC2s in live lung cells. n = 6. Data are representative of 3 independent experiments and are shown as mean ± SEM. *P < 0.05; **P < 0.01; ***P < 0.001, 2-way repeated-measures ANOVA with Bonferroni’s post hoc test (A); 1-way ANOVA with Tukey’s post hoc test (B, C, E, F, H, and J).
Figure 2
Figure 2. DEP NK cells have increased capacity to produce type 2 cytokines and degranulate.
(AG) Frequencies and features of lung NK cells in PBS-PBS, DEP-PBS, PBS-OVA, and DEP-OVA pups. (A) Percentages of NK cells (CD3CD19NK1.1+) in live lung cells. n = 9–10 mice per group. (B) Flow cytometry plots to detect NK cell subsets. CD3CD19NK1.1+ live lung cells were analyzed for CD11b and CD27. (C and D) Percentages of indicated subsets in live lung NK cells. n = 9–10 mice per group (BD: gating strategy in Supplemental Figure 2A). (E) Left: flow cytometry plots to measure degranulated (CD107a+) NK cells in lung digests. Lung cells were incubated at 37°C with PE-labeled anti-CD107a or isotype control IgG, monensin, brefeldin A, IL-2, and IL-15, and then stained with eFluor506 and antibodies for surface markers. Live NK cells (eFluor506CD3CD19NK1.1+) were analyzed for NK1.1 versus CD107a. Right: percentages of CD107a+ NK cells in live lung NK cells. n = 8. (F) Percentages of IL-5+ and IL-13+ NK cells in live lung NK cells. Result was obtained after ex vivo stimulation with PMA/ionomycin. n = 6. (G) Left: flow cytometry plot to identify GATA3+ NK cells. CD3CD19CD127NK1.1+ live lung cells (no ex vivo stimulation) from PBS-PBS and DEP-PBS pups were analyzed for GATA3 or binding of an isotype control immunoglobulin. Right: percentages of GATA3+ NK cells in live lung NK cells. n = 5. Data are representative of 2 independent experiments and are shown as mean ± SEM. *P < 0.05; **P < 0.01; ***P < 0.001, 1-way ANOVA with Tukey’s post hoc test (A and CF); 2-tailed unpaired t test (G).
Figure 3
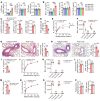
Figure 3. The type 2 immune response and AAD are driven by NK cells.
The type 2 immune response and AAD in Ncr1iCre/+R26DTA/+ and R26DTA/+ DEP-OVA pups (AJ), Ncr1iCre/+R26DTA/+ and R26DTA/+ DEP-OVA pups after injection of CD127 NK cells (from R26DTA/+ littermates) or PBS as in Supplemental Figure 3B (KN), and WT DEP-OVA pups after injection of anti–asialo-GM1 or control sera as in Supplemental Figure 3C (OQ). (A and B) Cytokines in lung homogenates (A, n = 12) and BAL fluid (B, n = 13–15). (C, E, F, and K) Cytokine+ CD4+ T cells (C, n = 6), IL25R+ST2, IL25R+ST2+, and IL25RST2+ ILC2s (E, n = 6; K, n = 6–8) and cytokine+ ILC2s (F, n = 6) in live lung cells. (D) OVA-specific IgE in serum. n = 9. (G, L, and O) Total lung resistance to methacholine. n = 6 (G and L); n = 5 (O). (H, J, N, and Q) H&E- and PAS-stained lung sections, inflammation scores, and areas of PAS+ epithelium. Original magnification, ×100. n = 7 (H); n = 8 (J, N, and Q). (I, M, and P) Leukocyte subsets in the BAL fluid. n = 8 (I); n = 6–8 (M); and n = 6 (P). Data are representative of 2 (A and B) or 3 (CQ) independent experiments and are shown as mean ± SEM. *P < 0.05; **P < 0.01; ***P < 0.001, 2-tailed unpaired t test for (AF, HJ, P, and Q); 1-way ANOVA with Tukey’s post hoc test (K, M, and N); 2-way repeated-measures ANOVA with Bonferroni’s post hoc test (G, L, O).
Figure 4
Figure 4. The type 2 immune response and AAD are dependent on IL-25.
(A and B) Concentrations of IL-25, IL-33, and TSLP in lung homogenates (A, n = 10 [IL-25] or n = 9 [IL-33, TSLP]) and BAL fluid (B, n = 10) from PBS-PBS, DEP-PBS, PBS-OVA, and DEP-OVA pups. (CP) Depletion of IL-25 (CH), IL-33 (IL), and TSLP (MP) in DEP-OVA pups. Pups received an anti-cytokine (anti–IL-25/anti–IL-33/anti-TSLP) antibody or isotype control IgG before immunization and then before the first challenge with OVA and were analyzed 72 hours after the final challenge (diagram of experimental strategy in Supplemental Figure 4B). (C) Percentages of IL25R+ST2 ILC2s, IL25R+ST2+ ILC2s, and IL25RST2+ ILC2s in live lung cells. n = 6. (D) OVA-specific IgE in the serum. n = 9. (E, J, and N) Total lung resistance to methacholine (FlexiVent). n = 5–6. (F, K, and O) Leukocyte subset counts in BAL fluid. n = 5–6. (G, H, L, and P) Images of H&E-stained lung sections. Original magnification, ×100. (G) Peribronchial inflammation scores (G, L, and P), images of PAS-stained lung sections (H), and proportions of bronchial epithelial areas that are PAS (mucin)+ (H, L, and P). n = 8–9 (anti–IL-25); n = 5 (anti–IL-33 and anti-TSLP). (I and M) Concentrations of IL-33 (I) and TSLP (M) in BAL fluid. n = 5. Data are representative of 2 (A, B, E, and IP) or 3 (C, D, and FH) independent experiments and are shown as mean ± SEM. *P < 0.05; **P < 0.01; ***P < 0.001, 1-way ANOVA with Tukey’s post hoc test (A and B); 2-tailed unpaired t test (C, D, FI, KM, O, P); and 2-way repeated-measures ANOVA with Bonferroni’s post hoc test (E, J, and N).
Figure 5
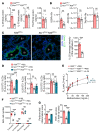
Figure 5. NK cells are upstream of IL-25.
(AC) IL-25, IL-33, and TSLP in DEP-OVA Ncr1iCre/+R26DTA/+ and R26DTA/+ littermates. (A) Concentrations of cytokines in lung homogenates. n = 6 mice per group. (B) Levels of cytokine mRNAs in lung lysates. Rn18s, 18S ribosomal RNA. n = 8–9. (C) Left: fluorescent microscopy images of lung sections stained with an anti–IL-25 antibody (green) and the nuclear dye DAPI (blue). Br, bronchus; BV, blood vessel. Original magnification, ×200. Right: average fluorescence intensity of the IL-25 signal in the airway epithelium. n = 8. (DG) IL-25 reconstitution. Pups were produced as in Figure 3, K–N. On postnatal day 5, pups were injected with OVA/alum mixed with IL-25 or PBS. IL-25/PBS injections were repeated on day 6, but this time no OVA/alum was used. All pups were OVA challenged on days 23 to 25. Six hours after each challenge, pups were i.t. administered IL-25 or PBS. Pups were analyzed on day 28 (diagram of experimental strategy in Supplemental Figure 5). (D) Percentages of IL25R+ST2 ILC2s, IL25R+ST2+ ILC2s, and IL25RST2+ ILC2s in live lung cells. n = 8–9. (E) Total lung resistance to methacholine. n = 7. (F) Leukocyte subset counts in BAL fluid. n = 8. (G) Peribronchial inflammation scores and proportions of bronchial epithelial areas that are PAS+. n = 7. Data are representative of 3 independent experiments and are shown as mean ± SEM. *P < 0.05; **P < 0.01; ***P < 0.001, 2-tailed unpaired t test (AC); 1-way ANOVA with Tukey’s post hoc test (D, F, and G); and 2-way repeated-measures ANOVA with Bonferroni’s post hoc test (E).
Figure 6
Figure 6. NK cells as carriers of susceptibility to AAD.
(AH) Transfer of NK cells from WT pups of DEP-exposed and PBS-exposed mothers (DEP NK cells and PBS NK cells, respectively) into Ncr1iCre/+R26DTA/+ pups of unexposed mothers. Prospective recipient pups were immunized with OVA/alum on postnatal day 5 (protocol 1, AD) or postnatal day 26 (protocol 2, EH). Donor pups were not immunized. Transfer of CD127 NK cells or PBS injection took place on day 22 (protocol 1) or day 43 (protocol 2), as in Figure 3, K–N. Recipients were challenged with OVA on days 23 to 25 (protocol 1) or days 44 to 46 (protocol 2) and analyzed on day 28 (protocol 1) or day 49 (protocol 2) (diagram of experimental strategy in Supplemental Figure 6). (A and E) Concentration of IL-25 in the BAL fluid of recipients. (B and F) Percentages of IL25R+ST2 ILC2s, IL25R+ST2+ ILC2s, and IL25RST2+ ILC2s in live lung cells of recipients. (C and G) Leukocyte subset counts in BAL fluid of recipients. (D and H) Peribronchial inflammation scores and proportions of bronchial epithelial cell areas that are PAS+. n = 6 (protocol 1); n = 5 (protocol 2). Data are representative of 2 independent experiments and are shown as mean ± SEM. **P < 0.01; ***P < 0.001, 1-way ANOVA with Tukey’s post hoc test.
Figure 7
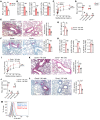
Figure 7. NK cell engagement is unique to maternal DEP-programmed AAD.
(AE) Adult mouse model of AAD. Unexposed Ncr1iCre/+ females were mated with unexposed R26DTA/DTA males. Ncr1iCre/+R26DTA/+ and R26DTA/+ offspring were i.p. immunized with OVA in alum on postnatal days 42 and 49, i.n. challenged with OVA on days 56, 57, and 58, and analyzed on day 61 (diagram of experimental strategy in Supplemental Figure 7). (FI) Neonatal mouse model of AAD. PBS-exposed Ncr1iCre/+ females were mated with unexposed R26DTA/DTA males to produce Ncr1iCre/+R26DTA/+ and R26DTA/+ littermates. Pups were immunized with OVA/alum on postnatal day 5, challenged with OVA on days 23 to 25, and analyzed on day 28. (A and F) Percentages of IL25R+ST2 ILC2s, IL25R+ST2+ ILC2s, and IL25RST2+ ILC2s in live lung cells. n = 7 mice per group (A); n = 9 (F). (B and G) Total lung resistance to methacholine. n = 6 (B); n = 8 (G). (C and H) Leukocyte subset counts in BAL fluid. n = 7 (C); n = 8 (H). (D) Left: H&E-stained lung sections. Original magnification, ×100. Right: peribronchial inflammation scores. n = 7. (E) Left: PAS-stained lung sections. Original magnification, ×100. Right: proportions of bronchial epithelial cell areas that are PAS+. n = 7. (I) Peribronchial inflammation scores and proportions of bronchial epithelial areas that are PAS+. n = 8. Data are representative of 3 (AI) independent experiments and are shown as mean ± SEM. Two-tailed unpaired t test (A, B, DF, and HI); 2-way repeated-measures ANOVA with Bonferroni’s post hoc test (C and G).
Figure 8
Figure 8. The NK cell granule protease granzyme B induces IL-25 in airway epithelial cells.
(A) Levels of mediator mRNAs in lungs of DEP-OVA Ncr1iCre/+R26DTA/+ and R26DTA/+ littermates. n = 10 mice per group. Lines within boxes represent medians, boxes represent 25th to 75th percentiles, and whiskers represent minimum and maximum values. (B) Left: gating strategy to define lung cell subsets that express granzyme B (GZMB). Right: proportions of indicated cell subsets in population of GZMB+ cells. n = 7. (C and D) Production of Il25, Il33, and Tslp mRNAs (C; cell lysates; n = 6 samples per group) and IL-25, IL-33, and TSLP proteins (D; culture supernatants; n = 6) by C57BL/6 Mouse Primary Tracheal and Bronchial Epithelial Cells (Cell Biologics Inc.) treated with vehicle (PBS), granzyme A (GZMA), granzyme B, cathepsin W (CTSW) ± IL-13, or extract of A. alternata. (E) Il25 mRNA in epithelial cells treated with GZMB, GZMB + PAR2 inhibitor (GB83 or ENMD-1068), and GZMB + PAR1 inhibitor (SCH79797 or vorapaxar); vehicle 1 = PBS (vehicle for GZMB), vehicle 2 = DMSO (vehicle for inhibitors). n = 8 (vehicle 1 + vehicle 2); n = 6 (other conditions). (F) Flow cytometric detection of dead cells in cultures of epithelial cells treated as in C and D or subjected to heat shock (positive control for cell death). (G) Flow cytometric detection of IL-25 in EpCAM+NK1.1 epithelial cells incubated with IL-13 ± NK cells from spleens of WT DEP-OVA pups. Histogram is representative of 3 independent cocultures. Data are representative of 2 (A and B) or 3 (CG) independent experiments and are shown as mean ± SEM. *P < 0.05; ***P < 0.001, 2-tailed unpaired t test (A); 1-way ANOVA with Tukey’s post hoc test (CE).
Figure 9
Figure 9. Granzyme B is required for development of AAD in predisposed pups.
(AF) Importance of systemic granzyme B. DEP-exposed Gzmb+/– females were mated with unexposed Gzmb+/– males to generate Gzmb–/– and Gzmb+/+ littermates. Pups were immunized, challenged with OVA, and analyzed 72 hours after challenge. (GL) Importance of NK cell–expressed granzyme B. Ncr1iCre/+R26DTA/+ pups were transferred with Gzmb+/+ and Gzmb–/– NK cells. Donor and recipients were the same age and were born to DEP-exposed mothers. Cell transfer took place on day 22 as in Figure 3, K–N. Before cell transfer, on postnatal day 5, donor and prospective recipient pups were immunized with OVA/alum. After cell transfer, recipients were challenged with OVA on days 23 to 25 and analyzed on day 28 (diagram of experimental strategy in Supplemental Figure 9). (A and G) Concentration of IL-25 in BAL fluid. n = 6 mice per group. (B and H) Percentages of IL25R+ST2 ILC2s, IL25R+ST2+ ILC2s, and IL25RST2+ ILC2s in live lung cells. n = 6. (C and I) Total lung resistance to methacholine. n = 6. (D and J) Leukocyte subset counts in BAL fluid. n = 6. (E and K) Left: H&E-stained lung sections. Original magnification, ×100. Right: peribronchial inflammation scores. n = 7. (F and L) Left: PAS-stained lung sections. Original magnification, ×100. Right: proportions of bronchial epithelial cell areas that are PAS+. n = 7. (M) Flow cytometric detection of IL-25 in EpCAM+NK1.1 airway epithelial cells that were incubated with IL-13 ± NK cells from spleens of DEP-OVA Gzmb+/+ and Gzmb–/– pups. Histogram is representative of 3 independent cocultures. Data are representative of 3 independent experiments and are shown as mean ± SEM. *P < 0.05; **P < 0.01; ***P < 0.001, 2-tailed unpaired t test (A, B, DH, and JL); 2-way repeated-measures ANOVA with Bonferroni’s post hoc test (C and I).
Figure 10
Figure 10. DEP NK cells drive HDM-induced AAD.
(AH) Model of early life HDM-induced AAD in the context of maternal exposure to DEP. Pups of DEP-exposed and PBS-exposed mothers received HDM intranasally on postnatal days 5 and 6 (immunization phase) and then on postnatal days 23, 24, and 25 (challenge phase). Pups were analyzed on postnatal day 28 (diagram of experimental strategy in Supplemental Figure 10). (IO) Genetic depletion of NK cells in DEP-HDM pups. DEP Ncr1iCre/+R26DTA/+ and R26DTA/+ littermate pups were generated as in Figure 3, A–J. After birth, pups were immunized and challenged with HDM and analyzed 72 hours after challenge. (A) Percentages of IL-5+ and IL-13+ NK cells in live lung NK cells (after ex vivo stimulation with PMA/ionomycin). n = 6 per group. (B and I) Percentages of IL-5+ and IL-13+ CD4+ T cells in live lung cells. n = 6. (C and J) HDM-specific IgE in the serum. n = 9. (D and K) Percentages of IL25R+ST2 ILC2s, IL25R+ST2+ ILC2s, and IL25RST2+ ILC2s in live lung cells. n = 5 (D); n = 10 (K). (E and L) Percentages of IL-5+ and IL-13+ ILC2s in live lung cells. n = 6. (F and M) Total lung resistance to methacholine. n = 6. (G and N) Leukocyte subset counts in BAL fluid. n = 5 (G); n = 8 (N). (H and O) Peribronchial inflammation scores (left, n = 5) and proportions of bronchial epithelial areas that are PAS+ (right, n = 5). Data are representative of 2 independent experiments and are shown as mean ± SEM. *P < 0.05; **P < 0.01; ***P < 0.001, 1-way ANOVA with Tukey’s post hoc test (AE, G, and H); 2-tailed unpaired t test (IL, N, and O); and 2-way repeated-measures ANOVA with Bonferroni’s post hoc test (F and M).
Figure 11
Figure 11. The NK cell pathway in human cell systems.
(AH) Human CBMCs were incubated with DEP, HDM, or vehicle (PBS) for 48 hours. To measure NK cell degranulation, PE-labeled anti-CD107a or isotype control IgG, monensin, and brefeldin A were then added for an additional 5 hours. To measure intracellular cytokines in NK cells, monensin and brefeldin A were added for an additional 4 hours. Cells were then stained with eFluor506 (viability) and antibodies for NK cell surface markers ± antibodies for cytokines. (A and C) Gating strategy to define degranulated (A) and cytokine-producing (C) NK cells. Lymphocytes (from the FSC-A vs. SSC-A plot) were gated on singlets and then on live cells (eFluor506). eFluor506 single lymphocytes were analyzed for CD56 and CD3. NK cells (CD56+CD3) were analyzed for CD107a (marking degranulated cells; A) or intracellular cytokines (C). (B and D) Representative flow cytometry plots showing anti-CD107a labeling of NK cells (B) and anti-cytokine labeling of NK cells (D) under 3 stimulation conditions (DEP, HDM, and vehicle). (EH) Percentages of degranulated (CD107a+) NK cells (E), IL-4+ NK cells (F), IL-5+ NK cells (G), and IFN-γ+ NK cells (H) in total live NK cells. n = 8 subjects. (I) Levels of IL25 and IL33 mRNAs in human primary airway epithelial cells treated with vehicle (PBS), human granzyme B ± human IL-13, human IL-13, or an extract of A. alternata. RNA18SN1, 18S ribosomal RNA. Data are pooled from 8 independent experiments (EH) or are representative of 3 independent experiments (I). Data are shown as mean ± SEM. *P < 0.05; **P < 0.01; ***P < 0.001, 2-tailed paired t test (EH); 1-way ANOVA with Tukey’s post hoc test (I).

References

    1. Bisgaard H, Bønnelykke K. Long-term studies of the natural history of asthma in childhood. J Allergy Clin Immunol. 2010;126(2):187–197. doi: 10.1016/j.jaci.2010.07.011. - DOI - PubMed
    1. Vercelli D. Does epigenetics play a role in human asthma? Allergol Int. 2016;65(2):123–126. doi: 10.1016/j.alit.2015.12.001. - DOI - PubMed
    1. Igartua C, et al. Ethnic-specific associations of rare and low-frequency DNA sequence variants with asthma. Nat Commun. 2015;6:5965. - PMC - PubMed
    1. von Mutius E, Martinez FD, Fritzsch C, Nicolai T, Roell G, Thiemann HH. Prevalence of asthma and atopy in two areas of West and East Germany. Am J Respir Crit Care Med. 1994;149(2 pt 1):358–364. - PubMed
    1. Riedler J, Eder W, Oberfeld G, Schreuer M. Austrian children living on a farm have less hay fever, asthma and allergic sensitization. Clin Exp Allergy. 2000;30(2):194–200. doi: 10.1046/j.1365-2222.2000.00799.x. - DOI - PubMed

Publication types

MeSH terms