An improved 7K SNP array, the C7AIR, provides a wealth of validated SNP markers for rice breeding and genetics studies
- PMID: 32407369
- PMCID: PMC7224494
- DOI: 10.1371/journal.pone.0232479
An improved 7K SNP array, the C7AIR, provides a wealth of validated SNP markers for rice breeding and genetics studies
Abstract
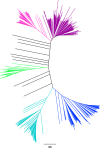
Single nucleotide polymorphisms (SNPs) are highly abundant, amendable to high-throughput genotyping, and useful for a number of breeding and genetics applications in crops. SNP frequencies vary depending on the species and populations under study, and therefore target SNPs need to be carefully selected to be informative for each application. While multiple SNP genotyping systems are available for rice (Oryza sativa L. and its relatives), they vary in their informativeness, cost, marker density, speed, flexibility, and data quality. In this study, we report the development and performance of the Cornell-IR LD Rice Array (C7AIR), a second-generation SNP array containing 7,098 markers that improves upon the previously released C6AIR. The C7AIR is designed to detect genome-wide polymorphisms within and between subpopulations of O. sativa, as well as O. glaberrima, O. rufipogon and O. nivara. The C7AIR combines top-performing SNPs from several previous rice arrays, including 4,007 SNPs from the C6AIR, 2,056 SNPs from the High Density Rice Array (HDRA), 910 SNPs from the 384-SNP GoldenGate sets, 189 SNPs from the 44K array selected to add information content for elite U.S. tropical japonica rice varieties, and 8 trait-specific SNPs. To demonstrate its utility, we carried out a genome-wide association analysis for plant height, employing the C7AIR across a diversity panel of 189 rice accessions and identified 20 QTLs contributing to plant height. The C7AIR SNP chip has so far been used for genotyping >10,000 rice samples. It successfully differentiates the five subpopulations of Oryza sativa, identifies introgressions from wild and exotic relatives, and is useful for quantitative trait loci (QTL) and association mapping in diverse materials. Moreover, data from the C7AIR provides valuable information that can be used to select informative and reliable SNP markers for conversion to lower-cost genotyping platforms for genomic selection and other downstream applications in breeding.
Conflict of interest statement
The authors have declared that no competing interests exist.
Figures


Similar articles
-
Large-scale deployment of a rice 6 K SNP array for genetics and breeding applications.Rice (N Y). 2017 Aug 30;10(1):40. doi: 10.1186/s12284-017-0181-2. Rice (N Y). 2017. PMID: 28856618 Free PMC article.
-
Genome-wide association mapping for yield and other agronomic traits in an elite breeding population of tropical rice (Oryza sativa).PLoS One. 2015 Mar 18;10(3):e0119873. doi: 10.1371/journal.pone.0119873. eCollection 2015. PLoS One. 2015. PMID: 25785447 Free PMC article.
-
A high-density SNP genotyping array for rice biology and molecular breeding.Mol Plant. 2014 Mar;7(3):541-53. doi: 10.1093/mp/sst135. Epub 2013 Oct 11. Mol Plant. 2014. PMID: 24121292
-
[Single nucleotide polymorphism (SNP) and its application in rice].Yi Chuan. 2006 Jun;28(6):737-44. Yi Chuan. 2006. PMID: 16818440 Review. Chinese.
-
Large SNP arrays for genotyping in crop plants.J Biosci. 2012 Nov;37(5):821-8. doi: 10.1007/s12038-012-9225-3. J Biosci. 2012. PMID: 23107918 Review.
Cited by
-
OMICs, Epigenetics, and Genome Editing Techniques for Food and Nutritional Security.Plants (Basel). 2021 Jul 12;10(7):1423. doi: 10.3390/plants10071423. Plants (Basel). 2021. PMID: 34371624 Free PMC article. Review.
-
Development of KASP markers, SNP fingerprinting and population genetic analysis of Cymbidium ensifolium (L.) Sw. germplasm resources in China.Front Plant Sci. 2025 Jan 8;15:1460603. doi: 10.3389/fpls.2024.1460603. eCollection 2024. Front Plant Sci. 2025. PMID: 39845486 Free PMC article.
-
Fine mapping and sequence analysis reveal a promising candidate gene encoding a novel NB-ARC domain derived from wild rice (Oryza officinalis) that confers bacterial blight resistance.Front Plant Sci. 2023 Aug 25;14:1173063. doi: 10.3389/fpls.2023.1173063. eCollection 2023. Front Plant Sci. 2023. PMID: 37692438 Free PMC article.
-
RicePilaf: a post-GWAS/QTL dashboard to integrate pangenomic, coexpression, regulatory, epigenomic, ontology, pathway, and text-mining information to provide functional insights into rice QTLs and GWAS loci.Gigascience. 2024 Jan 2;13:giae013. doi: 10.1093/gigascience/giae013. Gigascience. 2024. PMID: 38832465 Free PMC article.
-
Genome-Wide Association Mapping for Yield and Yield-Related Traits in Rice (Oryza Sativa L.) Using SNPs Markers.Genes (Basel). 2023 May 15;14(5):1089. doi: 10.3390/genes14051089. Genes (Basel). 2023. PMID: 37239449 Free PMC article.
References
Publication types
MeSH terms
Substances
LinkOut - more resources
Full Text Sources
Research Materials

