. 2020 May 14;15(5):e0232989.
doi: 10.1371/journal.pone.0232989. eCollection 2020.

COMBSecretomics: A pragmatic methodological framework for higher-order drug combination analysis using secretomics

Affiliations

COMBSecretomics: A pragmatic methodological framework for higher-order drug combination analysis using secretomics

Efthymia Chantzi et al. PLoS One. .

Abstract

Multi drug treatments are increasingly used in the clinic to combat complex and co-occurring diseases. However, most drug combination discovery efforts today are mainly focused on anticancer therapy and rarely examine the potential of using more than two drugs simultaneously. Moreover, there is currently no reported methodology for performing second- and higher-order drug combination analysis of secretomic patterns, meaning protein concentration profiles released by the cells. Here, we introduce COMBSecretomics (https://github.com/EffieChantzi/COMBSecretomics.git), the first pragmatic methodological framework designed to search exhaustively for second- and higher-order mixtures of candidate treatments that can modify, or even reverse malfunctioning secretomic patterns of human cells. This framework comes with two novel model-free combination analysis methods; a tailor-made generalization of the highest single agent principle and a data mining approach based on top-down hierarchical clustering. Quality control procedures to eliminate outliers and non-parametric statistics to quantify uncertainty in the results obtained are also included. COMBSecretomics is based on a standardized reproducible format and could be employed with any experimental platform that provides the required protein release data. Its practical use and functionality are demonstrated by means of a proof-of-principle pharmacological study related to cartilage degradation. COMBSecretomics is the first methodological framework reported to enable secretome-related second- and higher-order drug combination analysis. It could be used in drug discovery and development projects, clinical practice, as well as basic biological understanding of the largely unexplored changes in cell-cell communication that occurs due to disease and/or associated pharmacological treatment conditions.


Conflict of interest statement

The authors have declared that no competing interests exist.

Figures
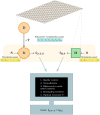
Fig 1
Fig 1. COMBsecretomics conceptual workflow.
Disease associated (D) and healthy (H) cells are kept on the same experimental plate to avoid inter-plate variability. D cells are exposed to each and every treatment T from an exhaustive combination panel; here a panel of all 7 possible treatments using 3 pre-selected drugs T1, T2 and T3 (at fixed concentrations) is shown as an example. D-treated and H cells are subsequently stimulated with each and every protein mixture S from a stimulation panel. Finally, release measurements for a protein panel of interest are collected for both cell types (fD,T, S and fH,S) using any technology that gives values proportional to the corresponding protein concentrations. The subsequent computational workflow include quality control procedures, normalization of the protein release differences (fD,T, SfH,S), model-free higher-order combination analysis and non-parametric resampling statistics. The goal of all these methodological principles is to come up with an optimal (combination) treatment T* that reverses malfunctioning protein release patterns, meaning fD,T*, SfH,S.
Fig 2
Fig 2. Therapeutic need quantification.
Example showing the quantitative answers provided to question Q1b, using data from the OA case study presented later in this work. The external stimulations used, denoted S1; S2; S3, are shown in the y-axis, while the proteins measured are shown in the x-axis. The value in each patch is quantified by employing Eq (2) in the context of answering question Q1b.
Fig 3
Fig 3. Miniaturization of the resampling based leave-one-out validation approach per plate.
Left: original collected protein release d-dimensional vectors f for the six different cell states supported by COMBSecretomics (H,To,So,H,To,Sy,D,To,So,D,To,Sy,D,Tx,So,D,Tx,Sy). For each cell state, four intra-plate replicate measurements are shown as rows along with the corresponding replicate number. D cells are either untreated (To) or treated (Tx) while H cells are untreated (To). Both D and H cells are either stimulated (Sy) or not (So). Experimental wells of different cell states are colored differently. Right: Nv user-defined validation datasets are automatically created by employing a leave-one-out procedure among the four intra-plate replicate measurements for each cell state.
Fig 4
Fig 4. COMBSecretomics flowchart.
Experimental flow: disease associated (D) and healthy (H) cells are treated and stimulated in parallel on the same experimental plate pi. An exhaustive combination panel is used for treating D cells, while a stimuli panel is employed for both D and H cells. An end point protein release assay of any sort can be used provided that it gives values proportional to the corresponding protein concentrations. Computational flow: a series of subsequent computational steps are employed for processing the protein release measurement values. Firstly, quality control procedures are employed. Secondly, protein release differences for stimulated and unstimulated cells are normalized per plate pi. Then two model-free combination analysis methods are employed using the normalized protein release differences. Finally, non-parametric resampling statistics are used to quantify uncertainty for the obtained combination analysis results. Graphic and text files with all results are created and saved automatically.
Fig 5
Fig 5. GHSA analysis for stimulation S1 and Nv = 103 validation datasets.
All four combination treatments T12, T13, T23, T123 are shown on the x-axis. Each combination treatment is represented by a box plot showing the minimum value, 25th, 50th, 75th percentiles and maximum value of all Nv GHSA indices obtained during a resampling-based leave-one-out validation approach.
Fig 6
Fig 6. Top-down hierarchical K-Means clustering for stimulation S1 and Nv = 103 validation datasets.
(a) Frequency/occurrence (%) for all unique partitions/clusters at the first hierarchical level. Annotations are provided for the three most frequent partitions. (b) Visualization of the clustering results after validation; the most dominant partitions at the first and second hierarchical levels are used. Each line corresponds to the centroid of each (sub-)cluster identified representing its restoration capacity defined by the normalized protein release differences between D, treated, stimulated with S1 (D, T, S1) and H, untreated, stimulated with S1 (H, UT, S1) cells. Solid and dotted lines are used for the first and second hierarchical level respectively. The gray solid line corresponds to the total therapeutic need, meaning the normalized protein release differences between D, untreated, stimulated with S1 (D, UT, S1) and H, untreated, stimulated with S1 (H, UT, S1) cells, which an ideal treatment should eradicate. The legend shows all treatments per (sub-)cluster identified without employing exhaustive subset search since only 7 treatments were used in total.

Similar articles

References

    1. Caruso Bavisotto C, Scalia F, Marino Gammazza A, Carlisi D, Bucchieri F, Conway de Macario E, et al. Extracellular Vesicle-Mediated Cell-Cell Communication in the Nervous System: Focus on Neurological Diseases. Int J Mol Sci. 2019;20(2). 10.3390/ijms20020434 - DOI - PMC - PubMed
    1. Brown KJ, Seol H, Pillai DK, Sankoorikal BJ, Formolo CA, Mac J, et al. The human secretome atlas initiative: implications in health and disease conditions. Biochim Biophys Acta. 2013;1834(11):2454–2461. 10.1016/j.bbapap.2013.04.007 - DOI - PMC - PubMed
    1. Zullo J, Matsumoto K, Xavier S, Ratliff B, Goligorsky MS. The cell secretome, a mediator of cell-to-cell communication. Prostaglandins Other Lipid Mediat. 2015;120:17–20. 10.1016/j.prostaglandins.2015.03.012 - DOI - PMC - PubMed
    1. Song P, Kwon Y, Joo JY, Kim DG, Yoon JH. Secretomics to Discover Regulators in Diseases. Int J Mol Sci. 2019;20(16). 10.3390/ijms20163893 - DOI - PMC - PubMed
    1. Brown KJ, Formolo CA, Seol H, Marathi RL, Duguez S, An E, et al. Advances in the proteomic investigation of the cell secretome. Expert Rev Proteomics. 2012;9(3):337–345. 10.1586/epr.12.21 - DOI - PMC - PubMed

Publication types

MeSH terms

Substances