. 2020 May 11;20(5):5.
doi: 10.1167/jov.20.5.5.

Looking away from a moving target does not disrupt the way in which the movement toward the target is guided

Affiliations

Looking away from a moving target does not disrupt the way in which the movement toward the target is guided

Clara Cámara et al. J Vis. .

Abstract

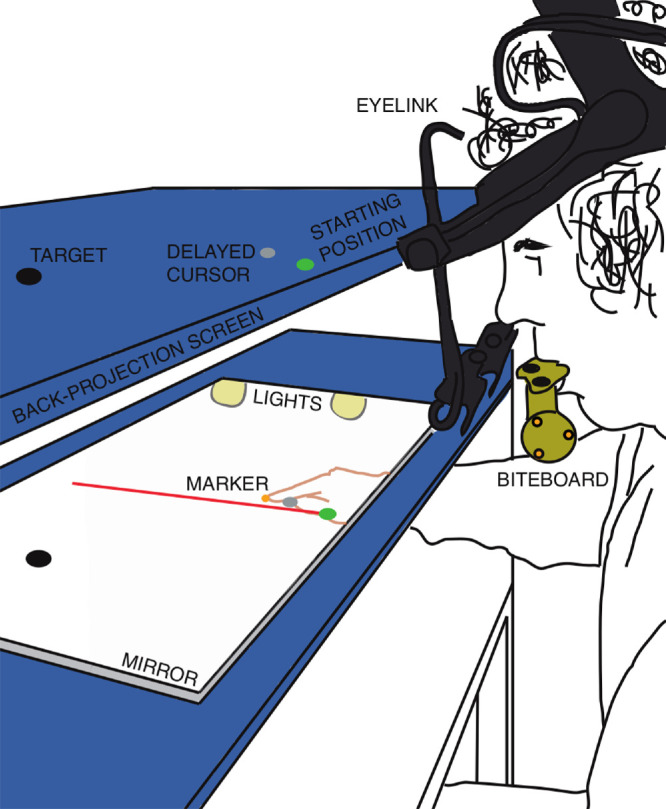
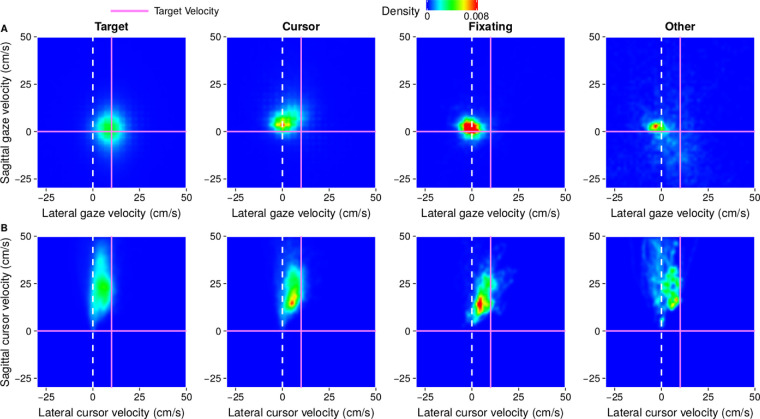
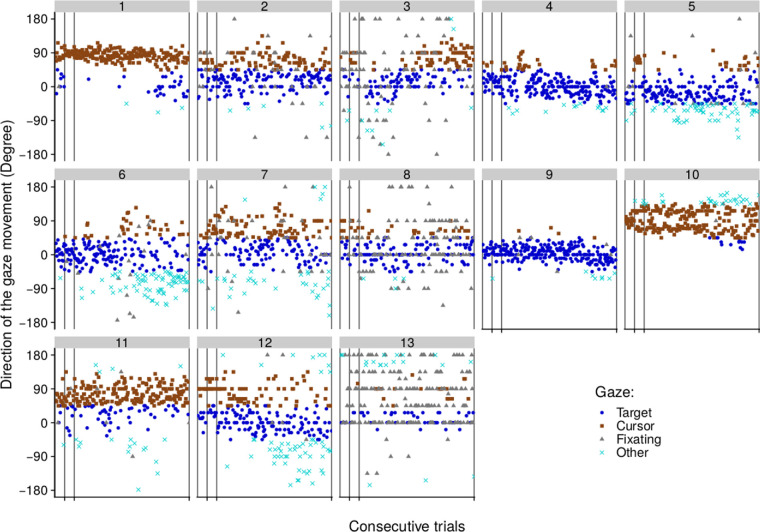
People usually follow a moving object with their gaze if they intend to interact with it. What would happen if they did not? We recorded eye and finger movements while participants moved a cursor toward a moving target. An unpredictable delay in updating the position of the cursor on the basis of that of the invisible finger made it essential to use visual information to guide the finger's ongoing movement. Decreasing the contrast between the cursor and the background from trial to trial made it difficult to see the cursor without looking at it. In separate experiments, either participants were free to hit the target anywhere along its trajectory or they had to move along a specified path. In the two experiments, participants tracked the cursor rather than the target with their gaze on 13% and 32% of the trials, respectively. They hit fewer targets when the contrast was low or a path was imposed. Not looking at the target did not disrupt the visual guidance that was required to deal with the delays that we imposed. Our results suggest that peripheral vision can be used to guide one item to another, irrespective of which item one is looking at.


Figures

Figure 1.
Figure 1.
Schematic representation of the setup. Images were projected from overhead onto a screen positioned above a half-silvered mirror, creating the illusion that the stimuli moved on the surface on which the participants performed the interceptive movement. Lights beneath the mirror were turned on during the calibration so participants could align their fingers with the calibration targets. Otherwise, the lights were off so participants could not see their hand but saw a cursor that followed their index finger with a certain delay.
Figure 2.
Figure 2.
Median gaze positions at various times before the finger crossed the path of the target. Positions are defined with respect to the position at which the finger crossed the path of the target. Separate columns represent the gaze categories, and rows represent the two experiments. The brightness of the trajectories gradually increases with the remaining time to cross the path of the target. In order to be able to combine the two directions of target motion, we mirrored the paths for leftward-moving targets. The plots confirm that gaze followed the target (moving from [–4, 0] to [0, 0] during the same time) for trials assigned to the Target category. Gaze followed the cursor for trials assigned to the Cursor category (the finger usually reached the target after the target had crossed the midline in Experiment 1). Gaze barely changed for trials assigned to the Fixating category. Gaze was difficult to interpret for the trials assigned to the Other category, which included very few trials.
Figure 3.
Figure 3.
Illustration of the gaze analysis. Lateral (A) and sagittal (B) gaze positions as a function of the time left before the attempt to hit the target for a representative trial that has been assigned to the Target (blue), Cursor (brown), and Fixating (gray) categories. The black line represents the position of the center of the target across time. Note that the target had a diameter of 2 cm, so whenever gaze positions were within 1 cm of the black line the eyes were directed at the target. The corresponding gaze velocities are shown both as a function of time (C, D) and relative to each other (E). The black straight lines in these panels represent the lateral and sagittal velocity of the target. Gaze velocities relative to each other (E) can be plotted as a heat map. (F) Heat map for 25 trials in which gaze was categorized as following the cursor. The density in this plot was normalized so that red represents the most frequent pair of velocities and blue represents any combination of velocities that did not happen. The intersection of the purple lines indicates the velocity of the target.
Figure 4.
Figure 4.
Gaze category per trial and participant in Experiment 1. Gaze median movement direction (zero is in the same direction as the target; positive is away from the body) and category (coded by color and shape) per trial (horizontal axis) and participant (different panels). Participants 1 to 3 are three of the authors. The vertical gray lines indicate the transitions between experimental conditions (No Feedback, D59, and Random Delay conditions, respectively).
Figure 5.
Figure 5.
Summary of gaze and cursor motion in Experiment 1. Heat maps of the occurrence of lateral and sagittal gaze (A) and cursor (B) velocities (or finger velocities in the No Feedback condition). Each column corresponds to a different gaze category. The intersections of the purple lines indicate the velocity of the target. The density scale is the fraction of instances within each category.
Figure 6.
Figure 6.
Interceptive behavior for the Target and Cursor categories in Experiment 1. Temporal error (time between the moment the finger crossed the path of the target and the moment the target crossed the position at which it did so) when gaze followed the target (A) and when it followed the cursor (B). The vertical lines separate the three conditions of No Feedback, D59, and Random Delay. The colored horizontal lines represent errors of 59 ms (red), 100 ms (green), 150 ms (blue), and 200 ms (violet), which are the errors one would expect if the cursor (rather than the finger) intercepted the target. Each point represents the average temporal error of trials with a certain delay within a block of 20 trials. Error bars are standard errors across participants’ mean values. The panels in the middle column show the percentage of trials that were assigned to the Target (C) and Cursor (D) categories. The bars are divided into four color-coded parts to show the percentage of trials for each temporal delay. The black diamonds indicate the percentage of trials that were hit in each block for the gaze category in question. The rightmost panels show the mean reaction times (triangles) and movement times (circles) of the finger for the same blocks of 20 trials for the Target (E) and Cursor (F) categories (with standard errors across participants).
Figure 7.
Figure 7.
Gaze category per trial and participant in Experiment 2. Details are as in Figure 4.
Figure 8.
Figure 8.
Summary of gaze and cursor motion in Experiment 2. Heat maps of the occurrence of lateral and sagittal gaze (A) and cursor (B) velocities (or finger velocity in the No Feedback condition) for the various gaze categories (in different columns). Details are as in Figure 5.
Figure 9.
Figure 9.
Interceptive behavior for Target, Cursor, and Fixating categories in Experiment 2. Performance measures for trials in which gaze was categorized as tracking the target (A, D, G) or the cursor (B, E, H), and when it was categorized as fixating (C, F, I). (A–C) Time difference between when the finger crossed the path of the target and when the target was at the position at which it did so. (D–F) Percentage of trials assigned to the category in question (bars) and percentage of trials hit (symbols). (G–I) Mean movement time (MT) and reaction time (RT). Details are as in Figure 6.
Figure 10.
Figure 10.
Average maximal distance between the finger and the red line within blocks of 20 trials. Symbols and error bars are means and standard errors across participants. Colors and shapes differentiate among the gaze categories. Vertical lines separate the three conditions.

Similar articles

Cited by

References

    1. Berkinblit M. B., Fookson O. I., Smetanin B., Adamovich S. V., & Poizner H. (1995). The interaction of visual and proprioceptive inputs in pointing to actual and remembered targets. Experimental Brain Research, 107(2), 326–330 - PubMed
    1. Bozzacchi C., Brenner E., Smeets J. B. J., Volcic R., & Domini F. (2018). How removing visual information affects grasping movements. Experimental Brain Research, 236(4), 985–995. - PMC - PubMed
    1. Braun D. I., Mennie N., Rasche C., Schütz A. C., Hawken M. J., & Gegenfurtner K. R. (2008). Smooth pursuit eye movements to isoluminant targets. Journal of Neurophysiology, 100(3), 1287–1300. - PubMed
    1. Brenner E., & Smeets J. B. J. (1997). Fast responses of the human hand to changes in target position. Journal Motor Behavior, 29(4), 297–310. - PubMed
    1. Brenner E., & Smeets J. B. J. (2003). Fast corrections of movements with a computer mouse. Spatial Vision, 16(3), 365–376. - PubMed

Publication types