. 2020 Jun 10;27(6):883-890.e2.
doi: 10.1016/j.chom.2020.04.017. Epub 2020 May 4.

Heightened Innate Immune Responses in the Respiratory Tract of COVID-19 Patients

Affiliations

Heightened Innate Immune Responses in the Respiratory Tract of COVID-19 Patients

Zhuo Zhou et al. Cell Host Microbe. .

Abstract

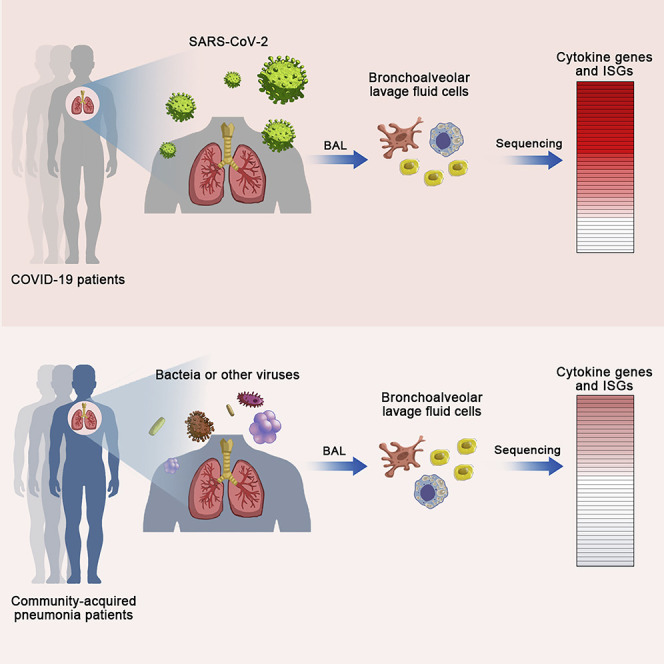
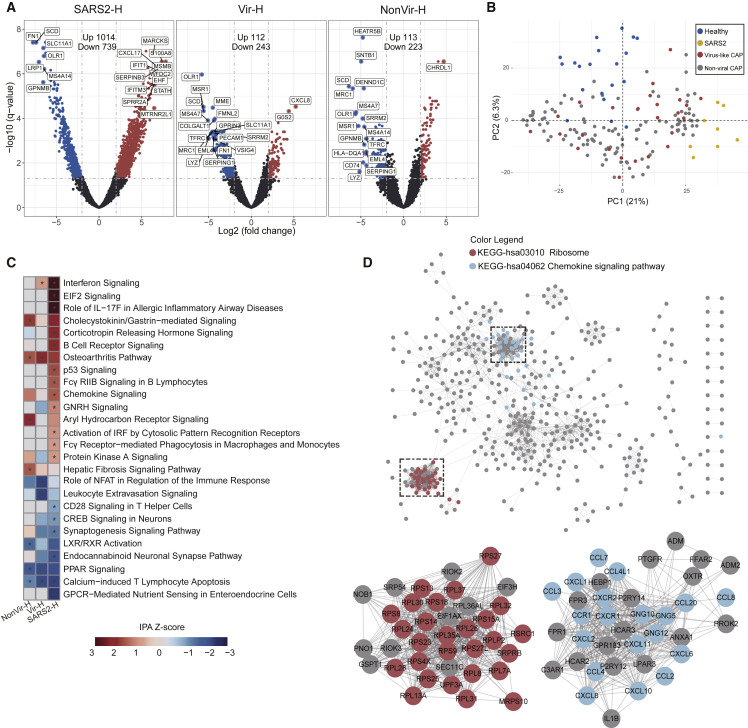
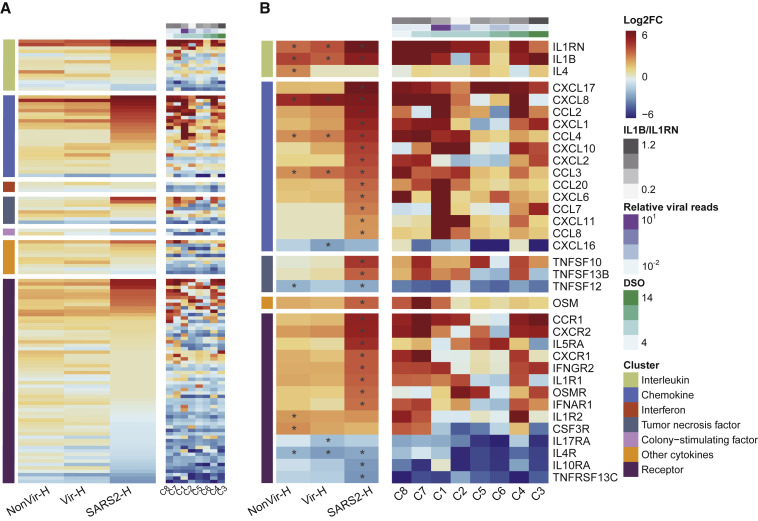
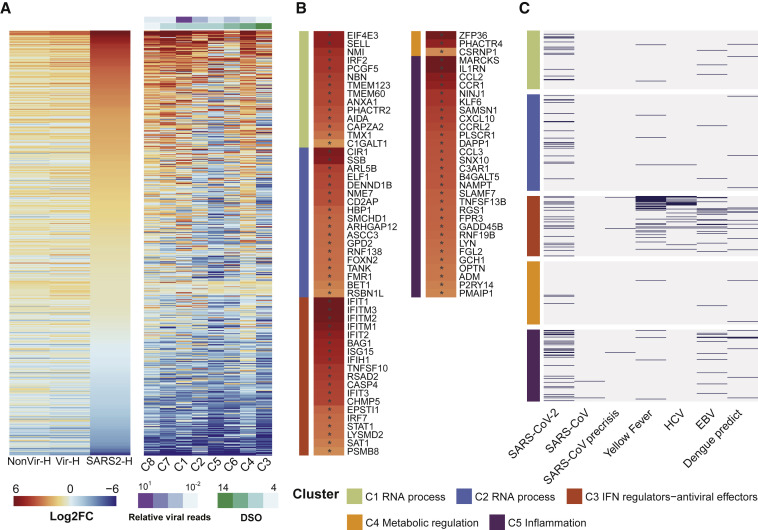
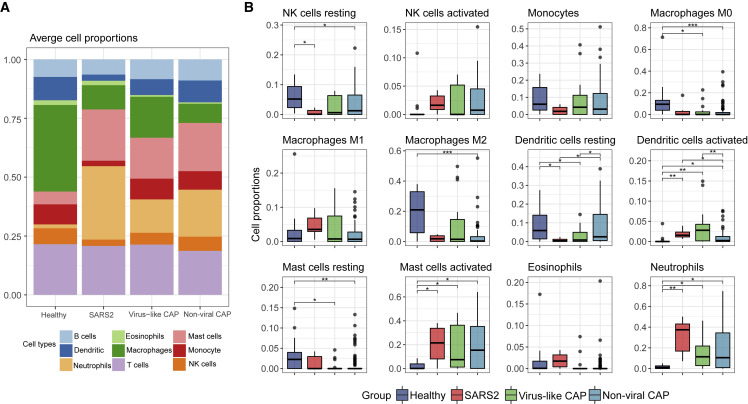
The outbreaks of 2019 novel coronavirus disease (COVID-19) caused by SARS-CoV-2 infection have posed a severe threat to global public health. It is unclear how the human immune system responds to this infection. Here, we used metatranscriptomic sequencing to profile immune signatures in the bronchoalveolar lavage fluid of eight COVID-19 cases. The expression of proinflammatory genes, especially chemokines, was markedly elevated in COVID-19 cases compared to community-acquired pneumonia patients and healthy controls, suggesting that SARS-CoV-2 infection causes hypercytokinemia. Compared to SARS-CoV, which is thought to induce inadequate interferon (IFN) responses, SARS-CoV-2 robustly triggered expression of numerous IFN-stimulated genes (ISGs). These ISGs exhibit immunopathogenic potential, with overrepresentation of genes involved in inflammation. The transcriptome data was also used to estimate immune cell populations, revealing increases in activated dendritic cells and neutrophils. Collectively, these host responses to SARS-CoV-2 infection could further our understanding of disease pathogenesis and point toward antiviral strategies.

Keywords: Bronchoalveolar lavage fluid; COVID-19; Chemokines; Coronavirus; Hypercytokinemia; Innate immune response; Interferon response; Interferon-stimulated genes; Metatranscriptomic sequencing; SARS-CoV-2.


Conflict of interest statement

Declaration of Interests The authors declare no competing interests.

Figures

None
Graphical abstract
Figure 1
Figure 1
Analysis of DEGs in BALF of COVID-19 and CAP Patients Compared to Healthy Controls (A) Volcano plot of DEGs comparing SARS2 versus Healthy (SARS2-H), Virus-like CAP versus Healthy (Vir-H), and Non-viral CAP versus Healthy (NonVir-H). The names of DEGs with the top 20 absolute FC are shown. (B) PCA loading plot based on all DEGs. Autoscaling of data was performed. (C) Functional enrichment analysis of DEGs with IPA. Asterisks () indicate q-values < 0.05 and absolute Z score ≥ 1. (D) PPI network of upregulated DEGs in SARS2 comparing to Healthy. Each node represents a protein, and interactions with confidence score > 0.9 are presented. See also Figure S2.
Figure 2
Figure 2
Cytokine-Related Gene Expressions in COVID-19 and CAP Patients (A) Heatmap of 218 genes encoding cytokines and receptors. (B) Heatmap of DEGs encoding cytokines and receptors. SARS2 samples (n = 8) were ordered by days after symptom onset (DSO) in the right panel of (A) and (B). Asterisks () indicate significant DEGs (absolute log2FC ≥ 2, q-value < 0.05). Relative viral reads (calculated by the ratio of SARS-CoV-2 reads to human reads) and the ratios of IL1B to IL1RN are shown in (A) and (B).
Figure 3
Figure 3
Expression of ISGs in COVID-19 and CAP Patients (A) Heatmap of 628 ISGs. SARS2 samples (n = 8) were ordered by days after symptom onset (DSO) in the right panel. (B) Heatmap of 83 upregulated ISGs in SARS2 comparing to Healthy. Asterisks () indicate significant DEGs (absolute log2FC ≥ 2, q-value < 0.05). (C) Upregulated ISGs in SARS-CoV-2 infection identified in this study, as well as in SARS-CoV and other viral infections (see Table S4). In (B) and (C), ISGs were assigned into five biclusters.
Figure 4
Figure 4
Composition of Immune Cells in BALF Predicted from Transcriptome Data (A) The proportion of nine major immune cell types. (B) The proportion of 12 innate-immunity-related cell subtypes. Asterisks represent significant differences between groups (q-value < 0.05, ∗∗q-value < 0.01, ∗∗∗q-value < 0.001, Mann-Whitney test). See also Figure S3.

Similar articles

Cited by

References

    1. Benjamini Y., Hochberg Y. Controlling the False Discovery Rate - a Practical and Powerful Approach to Multiple Testing. J. R. Stat. Soc. B. 1995;57:289–300.
    1. Cameron M.J., Ran L., Xu L., Danesh A., Bermejo-Martin J.F., Cameron C.M., Muller M.P., Gold W.L., Richardson S.E., Poutanen S.M., Canadian SARS Research Network Interferon-mediated immunopathological events are associated with atypical innate and adaptive immune responses in patients with severe acute respiratory syndrome. J. Virol. 2007;81:8692–8706. - PMC - PubMed
    1. Channappanavar R., Fehr A.R., Vijay R., Mack M., Zhao J., Meyerholz D.K., Perlman S. Dysregulated Type I Interferon and Inflammatory Monocyte-Macrophage Responses Cause Lethal Pneumonia in SARS-CoV-Infected Mice. Cell Host Microbe. 2016;19:181–193. - PMC - PubMed
    1. Channappanavar R., Fehr A.R., Zheng J., Wohlford-Lenane C., Abrahante J.E., Mack M., Sompallae R., McCray P.B., Jr., Meyerholz D.K., Perlman S. IFN-I response timing relative to virus replication determines MERS coronavirus infection outcomes. J. Clin. Invest. 2019;130:3625–3639. - PMC - PubMed
    1. Chaussabel D. Assessment of immune status using blood transcriptomics and potential implications for global health. Semin. Immunol. 2015;27:58–66. - PubMed