. 2020 Jul 22;107(2):306-319.e9.
doi: 10.1016/j.neuron.2020.04.020. Epub 2020 May 13.

MCH Neurons Regulate Permeability of the Median Eminence Barrier

Affiliations

MCH Neurons Regulate Permeability of the Median Eminence Barrier

Hong Jiang et al. Neuron. .

Abstract

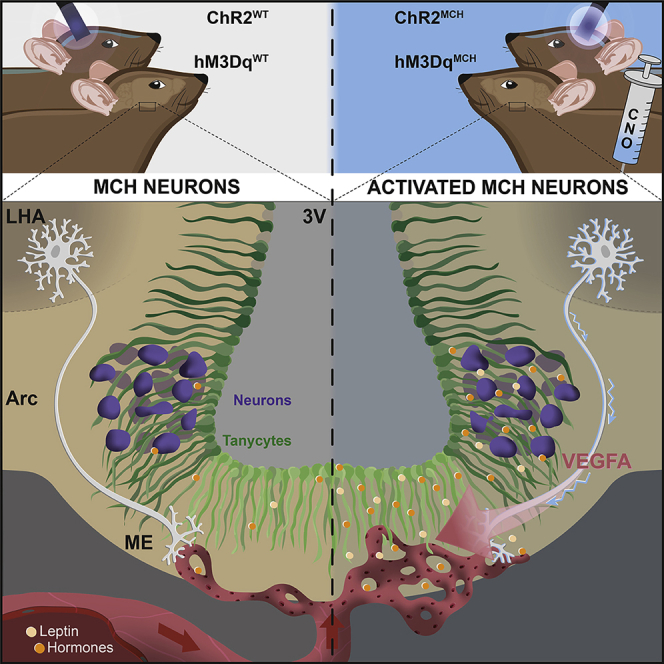
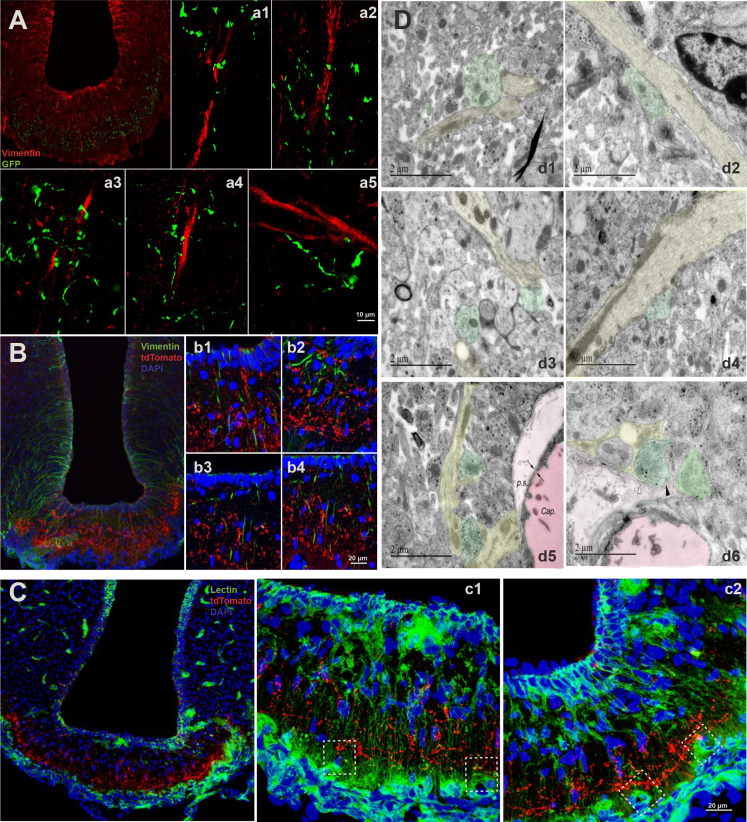
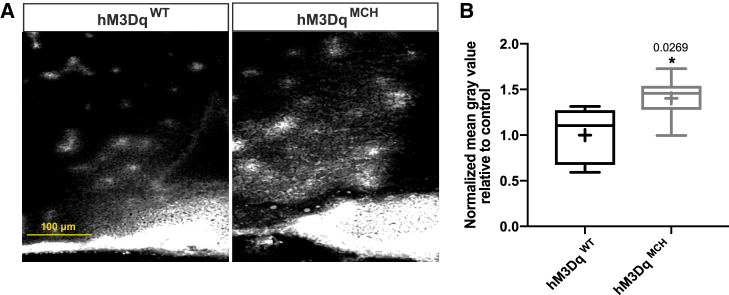
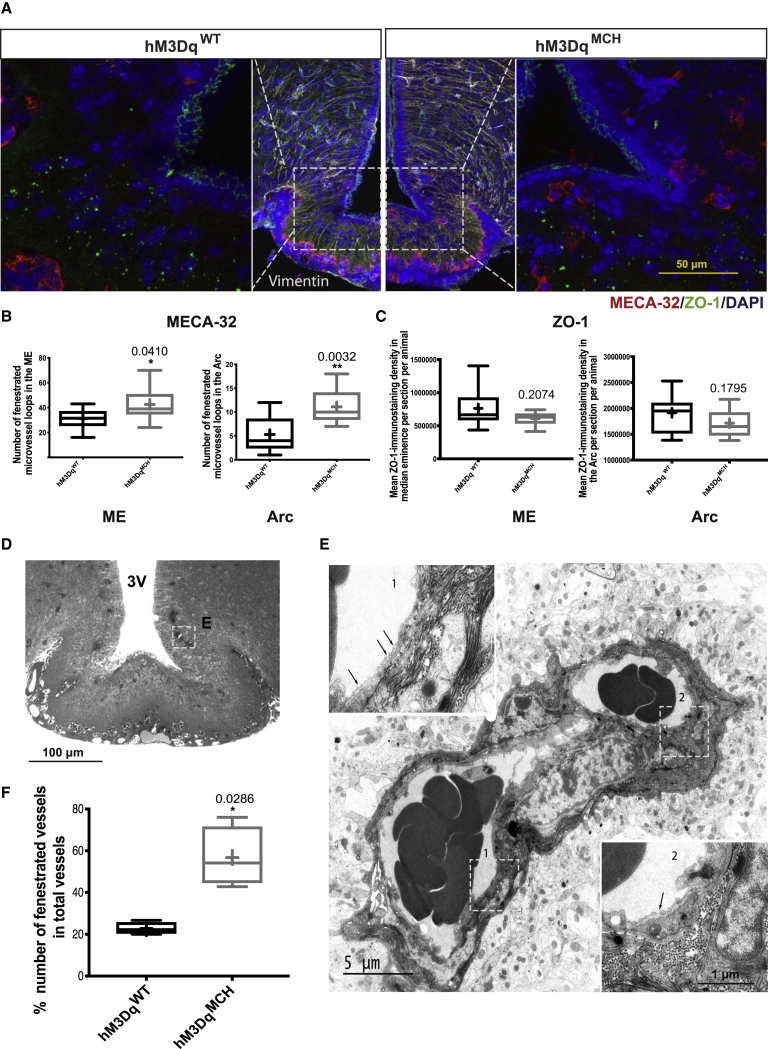
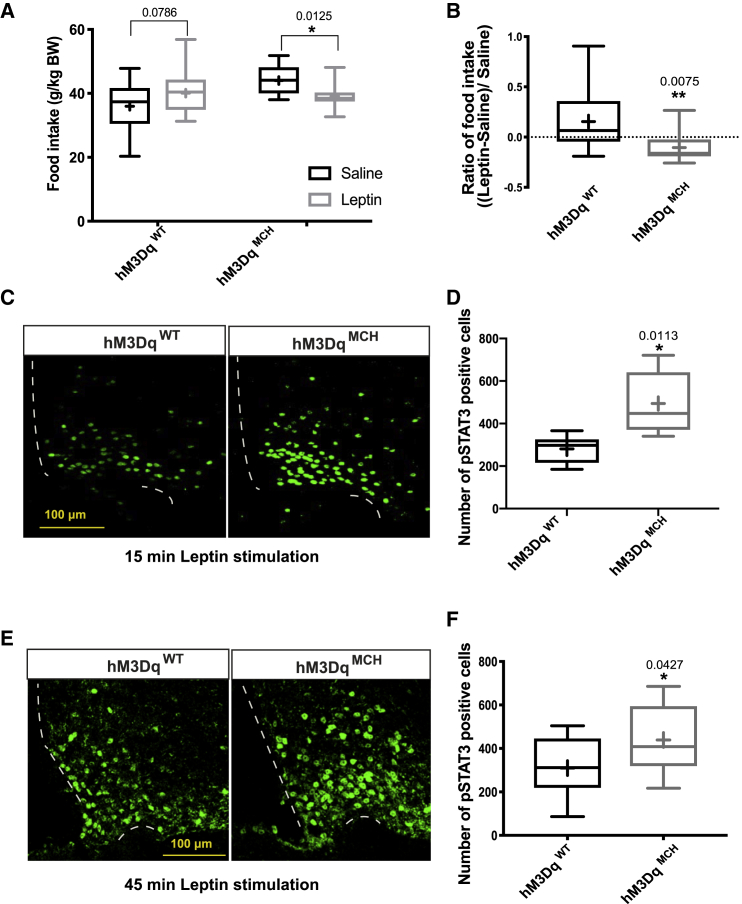
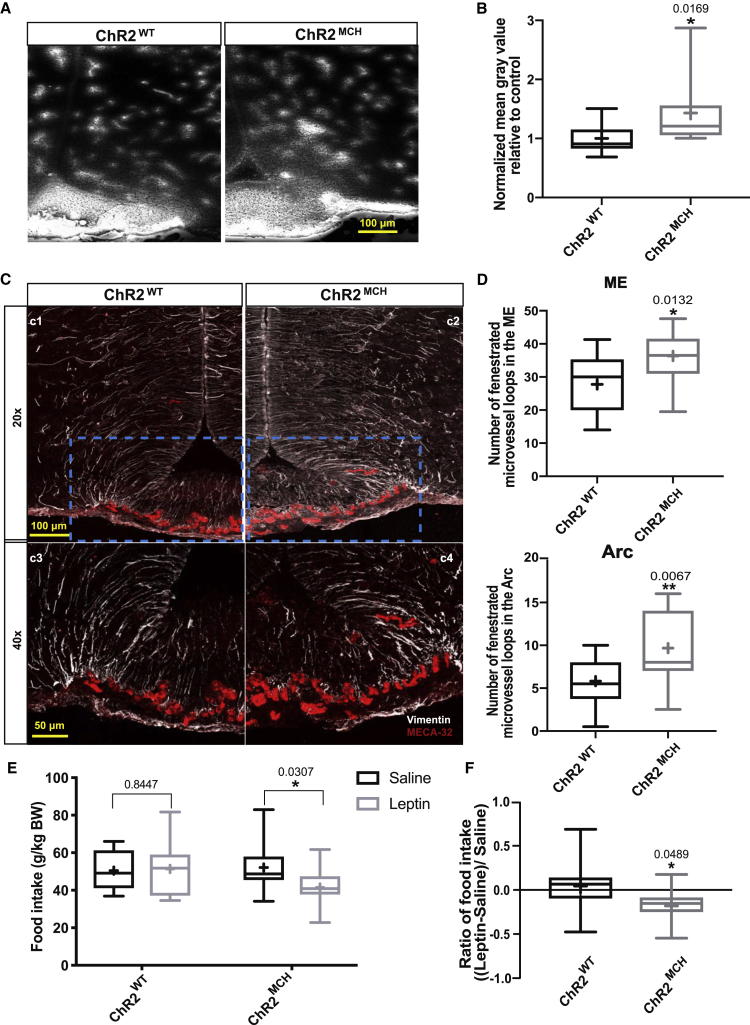
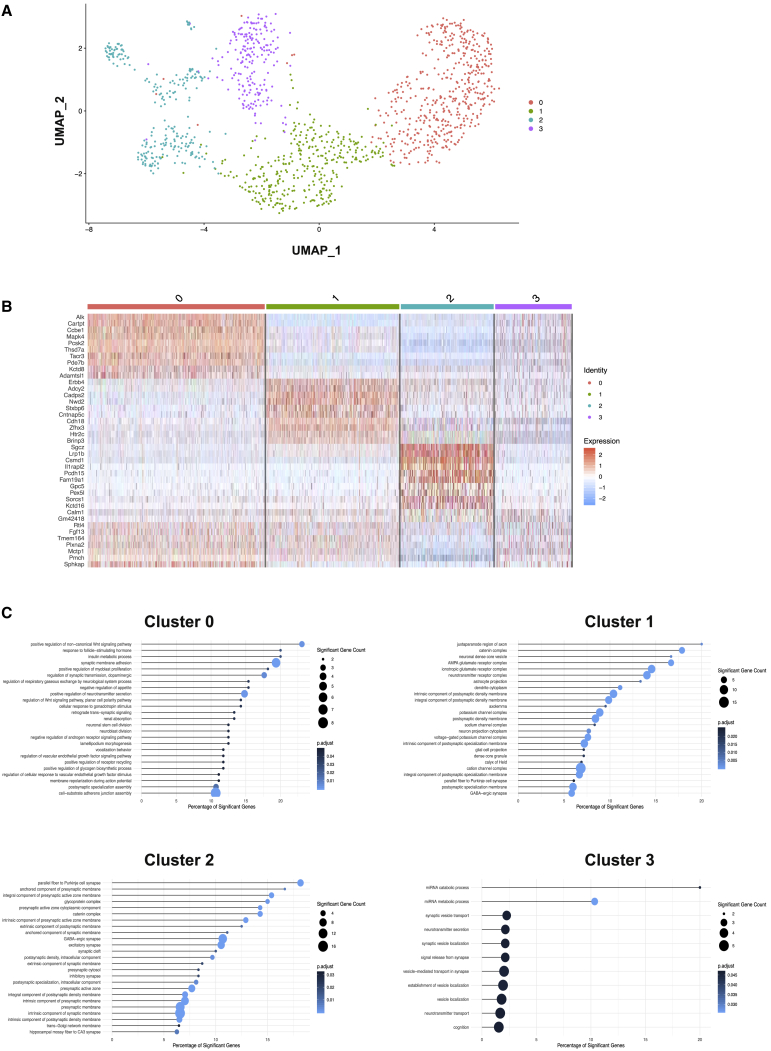
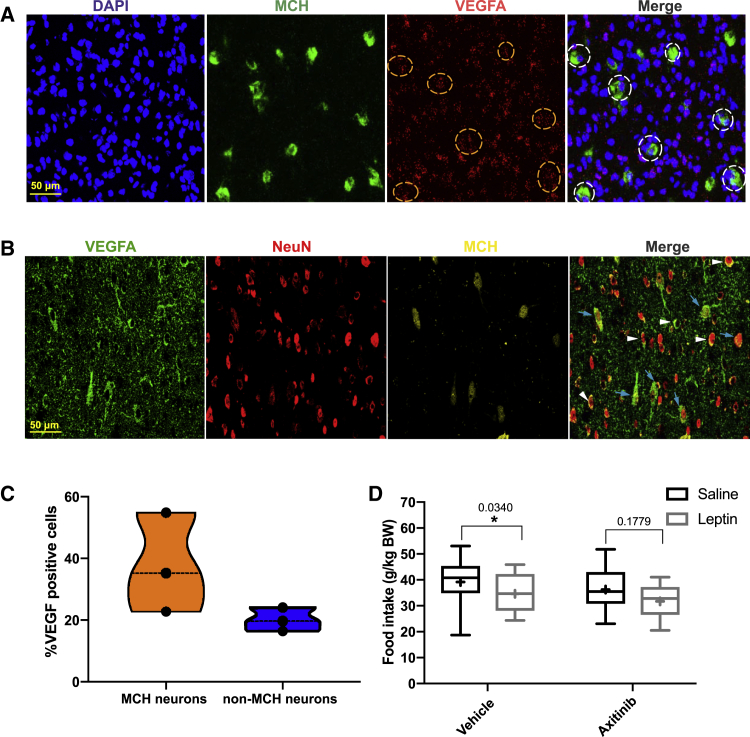
Melanin-concentrating hormone (MCH)-expressing neurons are key regulators of energy and glucose homeostasis. Here, we demonstrate that they provide dense projections to the median eminence (ME) in close proximity to tanycytes and fenestrated vessels. Chemogenetic activation of MCH neurons as well as optogenetic stimulation of their projections in the ME enhance permeability of the ME by increasing fenestrated vascular loops and enhance leptin action in the arcuate nucleus of the hypothalamus (ARC). Unbiased phosphoRiboTrap-based assessment of cell activation upon chemogenetic MCH neuron activation reveals MCH-neuron-dependent regulation of endothelial cells. MCH neurons express the vascular endothelial growth factor A (VEGFA), and blocking VEGF-R signaling attenuates the leptin-sensitizing effect of MCH neuron activation. Our experiments reveal that MCH neurons directly regulate permeability of the ME barrier, linking the activity of energy state and sleep regulatory neurons to the regulation of hormone accessibility to the ARC.

Keywords: MCH neurons; VEGF; blood brain barrier; body weight; energy homeostasis; feeding; fenestrated vessels; hypothalamus; leptin; median eminence; neuroendocrinology; obesity.


Conflict of interest statement

Declaration of Interests The authors declare no competing interests.

Figures

None
Graphical abstract
Figure 1
Figure 1
MCH Neuron Projections in the ME (A) Immunohistochemistry using anti-Vimentin (red) and anti-GFP antisera (green) in ARC/ME sections of ChR2-eYFPMCH mice; (a1)–(a)5 show enlarged exemplary regions from the ME region depicted in (A). (B) Immunohistochemistry using anti-Vimentin (green) and anti-tdTomato (red) in ARC/ME sections of Synaptophysin-tdTomatoMCH mice; (b1)–(b4) show enlarged exemplary regions from the ME region depicted in (B). (C) Immunohistochemistry using lectin (green) and anti-tdTomato (red) in ARC/ME sections of Synaptophysin-tdTomatoMCH mice; (c1) and (c2) show enlarged exemplary regions from the ME region depicted in (C). Dashed white square in (c1) and (c2) show the close contact between lectin-positive vessels and MCH neuron terminals. (D) Electron microscopy of the ME sections in Synaptophysin-tdTomatoMCH mice. Tanycytic processes are marked in yellow, as defined by their elongated mitochondria; the presence of electron-dense cytoskeletal bundles as well as glycogen storage and MCH nerve terminals are marked in green that contain silver-amplified highly electron-dense particles (d1–d4). (d5) and (d6) taken from external zone of ME, where neuroendocrine terminals reach close proximity to the pericapillary space (p.s., light pink) of the pituitary portal vessel (dark pink) capillary plexus (Cap.). The two arrows in the bottom left panel show a fenestration in the endothelium. In (d6), the black arrowhead shows a tomato-immunoreactive nerve terminal (green) contacting the parenchymatous basal lamina delineating the pericapillary space; the white arrowhead shows a thin tanycytic process (yellow) inserted between the MCH nerve terminal (green) and the basal lamina. Scale bars: 10 μm in (A), 20 μm in (B), 20 μm in (C), and 2 μm in (D).
Figure 2
Figure 2
Chemogenetic Activation of MCH Neurons Enhances the Permeability of the ME Barrier (A) Representative images of Evans blue dye diffusion into the ARC region of fasted and 4-h CNO-injected control and hM3DqMCH mice. (B) Quantification of Evans blue dye diffusion upon CNO treatment of control (n = 5) and hM3DqMCH mice (n = 7). Bar graphs represent the min to max value, the mean value is marked as “+”. Statistical analysis: unpaired Student’s t test, p < 0.05.
Figure 3
Figure 3
Chemogenetic Activation of MCH Neurons Enhances the Permeability of the ME Barrier through Increased Fenestration of Microvessel Loops (A) Representative images of anti-MECA-32 (red), anti-tight-junction-1 (ZO-1, green), and anti-Vimentin (white) immunoreactivity in the ME region. The left image shows a hemisection of a CNO-treated control animals and the right show a hemisection of a CNO-treated hM3DqMCH mouse. (B and C) Quantification of number of MECA-32-marked microvessel loops (B) d and ZO-1-marked tight junction complexes (C) in both the ME and the ARC region of fasted and CNO treatment of control (n = 6–10) and hM3DqMCH mice (n = 9–11). (D) Light microscopy image showing the capillaries illustrated in (E) (white square) in a 1-μm-thick semithin section. (E) Representative electron microscopy image showing two fenestrated capillaries (see fenestrae shown by arrows in insets 1 and 2) in the ventromedial ARC of a CNO-treated hM3DqMCH mice. (F) Quantification of capillary fenestration upon fasted and CNO-treated control (n = 4) and hM3DqMCH mice (n = 4). Bar graphs represent the min to max value, the mean value is marked as “+”. Statistical analysis: unpaired Student’s t test, p < 0.05.
Figure 4
Figure 4
Chemogenetic Stimulation of MCH Neurons Promotes Leptin Action (A) Assessment of leptin sensitivity by comparing the effect of saline or leptin injection on 1-h refeeding food intake in CNO-treated control (n = 16) and hM3DqMCH mice (n = 13). (B) The ratio of (food intake in leptin treated condition–food intake in saline treated condition)/food intake in saline-treated condition in CNO-treated control (n = 16) and hM3DqMCH mice (n = 13). (C) Representative image of pSTAT3 immunoreactivity in CNO-treated control and hM3DqMCH mice with 15-min leptin stimulation. (D) Quantification of the number of pSTAT3-positive cells in the ARC of 15-min leptin-injected, fasted, and CNO-treated control (n = 6) and hM3DqMCH mice (n = 5). (E) Representative image of pSTAT3 immunoreactivity in CNO-treated control and hM3DqMCH mice with 45-min leptin stimulation. (F) Quantification of the number of pSTAT3-positive cells in the ARC of 45-min leptin-injected, fasted, and CNO-treated control (n = 12) and hM3DqMCH mice (n = 13). Bar graphs represent the min to max value, the mean value is marked as “+”. Statistical analysis: unpaired Student’s t test, p < 0.05, ∗∗p < 0.01, except leptin sensitivity where a paired Student’s t test was used, p < 0.05.
Figure 5
Figure 5
Optogenetic Stimulation of MCH-ME Projections Promotes Leptin Action (A) Representative images of Evans blue dye diffusion into the ARC region of fasted and 3.5-h blue-light-illuminated control and ChR2MCH mice. (B) Quantification of Evans blue dye diffusion upon blue light illuminated of control (n = 14) and ChR2MCH mice (n = 12). (C) Representative images of anti-MECA-32 (red) and anti-Vimentin (white) immunoreactivity in the ME region. The left image (c1) shows a left hemisection of a blue-light-illuminated control mouse, and the right images shows (c2) a right hemisection of a blue-light-illuminated ChR2MCH mouse. Bottom panel shows the magnified images (c3 and c4) from (c1) and (c2). (D) Quantification of the number of MECA-32-marked microvessel loops in both the ME and the ARC region of blue-light-illuminated control (n = 17) and ChR2MCH mice (n = 11). (E and F) Same comparison of leptin sensitivity as depicted in Figure 4A and 4B, upon blue-light-illumination above the ME of control (n = 12) and ChR2MCH mice (n = 11). Bar graphs represent the min to max value, the mean value is marked as “+”. Statistical analysis: unpaired Student’s t test, p < 0.05, ∗∗p < 0.01, and ∗∗∗p < 0.001, except leptin sensitivity comparison by paired Student’s t test, p < 0.05.
Figure 6
Figure 6
Single-Nucleus Sequencing of MCH Neurons (A) Heterogenous cell clusters of MCH neurons based on single-nucleus sequencing from ZsGreenMCH reporter mice. (B) Heatmap of cell clusters with marker genes of MCH neurons. Color code on the top same as (A). Color scale indicates gene expression level. (C) Gene Ontology (GO) term analysis of each MCH cell cluster. GO term significance mapped to color. Percentage of significant genes depicts the ratio of significant genes in GO term to all genes defining the term in percent.
Figure 7
Figure 7
VEGFA Expression in MCH Neurons (A) Representative images from in situ hybridizations for VEGFA and MCH in LHA sections. Green, MCH; red, VEGFA; blue, 4′,6-diamidino-2-phenylindole (DAPI). In the merged image, white dashed circles show coexpression of VEGFA and MCH. Orange dashed circles in the VEGFA expression image are corresponding positions to white dashed circles. (B) Representative images of immunoactive VEGFA, NeuN, and MCH/tdTomato signal in LHA sections. Green, anti-VEGFA; red, anti-NeuN, neuronal marker; yellow, tdTomato. In the merged image, blue arrows point out MCH neurons expressing VEGFA, and white arrows point out non-MCH neurons expressing VEGFA. (C) Quantification of the coexpression percentage of VEGFA expression in MCH neurons, and in non-MCH neurons. (D) Assessment of leptin sensitivity by comparing the effect of saline or leptin injection on 1-h refeeding food intake in 16-h fasted and CNO-treated-hM3DqMCH mice (n = 10) upon vehicle or Axitinib pretreatment. Data are represented in a violon plot (C); in (D), bar graphs represent the min to max value, the mean value is marked as “+”. Statistical analysis: leptin sensitivity comparison by paired Student’s t test, p < 0.05. Scale bar: 50 μm in (A) and (B).

Comment in

Similar articles

Cited by

References

    1. Betley J.N., Xu S., Cao Z.F.H., Gong R., Magnus C.J., Yu Y., Sternson S.M. Neurons for hunger and thirst transmit a negative-valence teaching signal. Nature. 2015;521:180–185. - PMC - PubMed
    1. Bittencourt J.C. Anatomical organization of the melanin-concentrating hormone peptide family in the mammalian brain. Gen. Comp. Endocrinol. 2011;172:185–197. - PubMed
    1. Blanco-Centurion C., Luo S., Spergel D.J., Vidal-Ortiz A., Oprisan S.A., Van den Pol A.N., Liu M., Shiromani P.J. Dynamic Network Activation of Hypothalamic MCH Neurons in REM Sleep and Exploratory Behavior. J. Neurosci. 2019;39:4986–4998. - PMC - PubMed
    1. Brandt C., Nolte H., Henschke S., Engstrom Ruud L., Awazawa M., Morgan D.A., Gabel P., Sprenger H.G., Hess M.E., Gunther S. Food Perception Primes Hepatic ER Homeostasis via Melanocortin-Dependent Control of mTOR Activation. Cell. 2018;175:1321–1335.e1320. - PMC - PubMed
    1. Butler A., Hoffman P., Smibert P., Papalexi E., Satija R. Integrating Single-Cell Transcriptomic Data Across Different Conditions, Technologies, and Species. Nat Biotechnol. 2018;36:411–420. - PMC - PubMed

Publication types

MeSH terms