. 2020 Jun 2;118(11):2627-2640.
doi: 10.1016/j.bpj.2020.03.035. Epub 2020 Apr 23.

TENSCell: Imaging of Stretch-Activated Cells Reveals Divergent Nuclear Behavior and Tension

Affiliations

TENSCell: Imaging of Stretch-Activated Cells Reveals Divergent Nuclear Behavior and Tension

Benjamin Seelbinder et al. Biophys J. .

Abstract

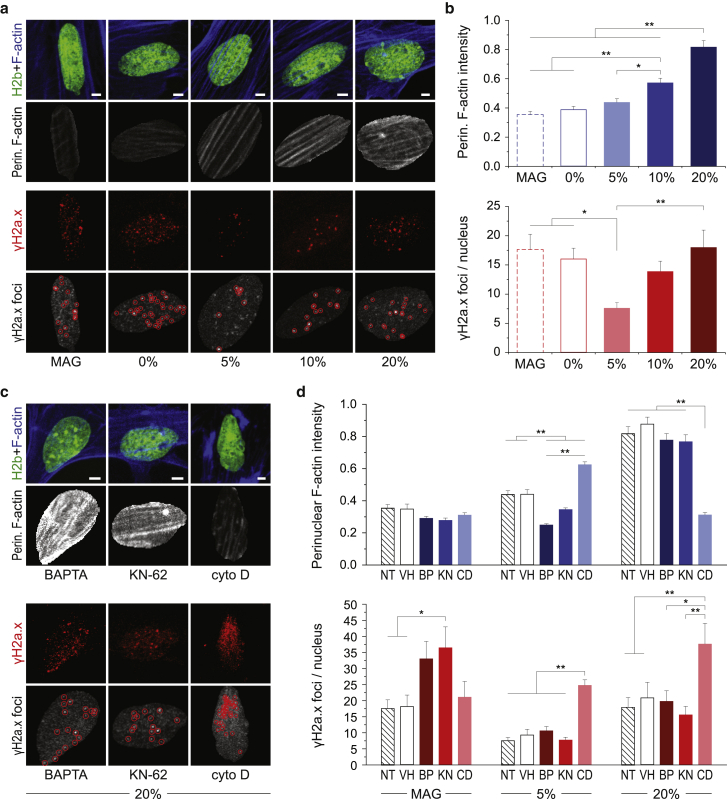
Mechanisms of cellular and nuclear mechanosensation are unclear, partially because of a lack of methods that can reveal dynamic processes. Here, we present a new concept for a low-cost, three-dimensionally printed device that enables high-magnification imaging of cells during stretch. We observed that nuclei of mouse embryonic skin fibroblasts underwent rapid (within minutes) and divergent responses, characterized by nuclear area expansion during 5% strain but nuclear area shrinkage during 20% strain. Only responses to low strain were dependent on calcium signaling, whereas actin inhibition abrogated all nuclear responses and increased nuclear strain transfer and DNA damage. Imaging of actin dynamics during stretch revealed similar divergent trends, with F-actin shifting away from (5% strain) or toward (20% strain) the nuclear periphery. Our findings emphasize the importance of simultaneous stimulation and data acquisition to capture mechanosensitive responses and suggest that mechanical confinement of nuclei through actin may be a protective mechanism during high mechanical stretch or loading.


Figures

Figure 1
Figure 1
TENSCell device allows for precise and repeatable membrane stretch via electromagnetic force. (a) A cross-sectional illustration of the stretch device and its control circuit is shown. A suspended piston containing a permanent magnet moves vertically through an electromagnetic coil. Downward motion of the piston stretches a silicon membrane over a deformation ring, which holds the stretched membrane at a constant distance over a microscope objective. See Fig. S1b for real images of the device. To control the electromagnet, an H-bridge is used to modulate intensity and direction of a constant current (6 A) from a DC power source through low voltage signals using an Arduino microprocessor. On the Arduino, a power-wave-modulation pin (∼, 0–5 V) is used to control the intensity, and a digital pin (D, 0 or 1) is used to control the direction of the current. A USB interface enables control of the Arduino inputs via MATLAB. (b) A distance measurement laser was used to investigate piston movement, and thereby membrane indentation, in response to electromagnetic force as represented by Arduino input voltages. Electromagnetic force could be used for the precise membrane stretch. (c) A sinusoidal function was programmed in MATLAB to generate Arduino inputs from +0.8 to −0.8 V at a frequency of 1 Hz, and piston indentation was recorded over five cycles. Electromagnetic force could be used for precise and repeatable membrane indentation. To see this figure in color, go online.
Figure 2
Figure 2
TENSCell device calibration and performance using particle tracking. Membrane containment wells were coated with 2-μm-sized fluorescent beads, and membrane strains at different Arduino input voltages were determined from bead displacements. The start point of the calibration was the offset Arduino input voltage (+0.8 V; see Fig. S2b) at which the membrane rests on the deformation ring without stretch. (a) An example of recorded bead displacements and the resulting strain map for an Arduino input of −0.9 V are shown. (b) Calibration curve as determined through bead displacements is shown. The acquired data fit a second-order polynomial function; SD; n = 3. (c) Plotting calculated membrane strains over measured membrane indentations from Fig. 1b showed a linear relationship. (d) Measurements of consecutive membrane indentation for an Arduino input of −0.9 V showed repeatable application of strain within 0.5%. To see this figure in color, go online.
Figure 3
Figure 3
MSF nuclei show opposing changes in nuclear area and chromatin condensation during low-strain and high-strain cyclic stretch. MSFs were exposed to 30 min of sinusoidal stretch with peak strains of 0, 5, 10, or 20%, followed by 30 min of no stimulation (rest), during which image stacks of nuclei were recorded. Control cells were exposed to the magnetic field alone without stretch (MAG). (a) Images of nuclei recorded via H2b-eGFP are given; scale bars, 5 μm. (b) Relative changes in nuclear area (relative to 0 min) during stretch routines are shown. Nuclear areas decreased in response to high strains (10, 20%), but increased for low strain (5%), whereas exposure to the magnetic field alone (MAG) showed no difference compared to unstretched cells (0%). (c) Difference in H2b histogram kurtosis and skewness (compared with 0 min) during stretch routines is shown. Kurtosis and skewness increased under high-strain routines (10, 20%), whereas they decreased for low strain (5%), indicating elevated or subsided chromatin condensation, respectively; SEM; n > 24 from four exp.; ANOVA: #p < 0.01 for 20% vs. all, $p < 0.01 for 10% vs. all, p < 0.01 or p < 0.05 for 5% vs. 10%, &p < 0.01 or %p < 0.05 for 20% vs. MAG, 0 and 5%, +p < 0.05 for 5% vs. MAG, ×p < 0.05 for 5% vs. MAG and 0%. To see this figure in color, go online.
Figure 4
Figure 4
The actin skeleton, but not calcium signaling, is required for nuclear responses to high-strain cyclic stretch. MSFs were treated with BAPTA (BP), KN-62 (KN), or cyto D (CD) before being exposed to 30 min of sinusoidal stretch with peak strains of 5, 20, or 0% under the influence of the magnetic field alone (MAG), during which image stacks of nuclei were recorded. (a) Images of nuclei recorded via H2b-eGFP before (0 min) or after (30 min) cyclic stretch routines are given; scale bars, 5 μm. (b) CD treatment inhibited changes in nuclear area and chromatin condensation in response to 5 and 20% cyclic stretch compared to NT or VH control cells. BP or KN treatment abrogated the increase in nuclear area and decrease in chromatin condensation after 5% cyclic stretch but had no effect after 20% cyclic stretch; NT cell data same as Fig. 3 for MAG, 5 and 20%, respectively; SEM; n ≥ 15 from three exp.; ANOVA: p < 0.05, ∗∗p < 0.01. To see this figure in color, go online.
Figure 5
Figure 5
Perinuclear F-actin increases with strain magnitude, and actin depolymerization leads to increased DNA damage after low- and high-strain cyclic stretch. MSFs were exposed to 30 min sinusoidal stretch routines with peak strains of 0, 5, or 20%, or under the influence of the magnetic field alone (MAG), after which cells were stained for γH2a.x, as an indicator of DNA double-strand breaks, and F-actin. (a) Stained images of nuclei after stretch routines are given. A custom MATLAB code was used to analyze perinuclear F-actin intensities, using H2b-eGFP as a mask, and to identify γH2a.x foci, as indicated by red circles. (b) Perinuclear F-actin intensities and number of γH2a.x foci increased with strain magnitude; however, the highest levels of DNA damage were observed for static control cells. (c and d) MSFs were treated with BP, KN, or CD before stretch routines. Inhibition of calcium signaling via BP and KN treatment abrogated increases in perinuclear F-actin intensities in response to 5%, but not 20%, cyclic stretch. Actin depolymerization altered F-actin intensities and showed increased number of foci after both 5 and 20% cyclic stretch, whereas DNA damage was only increased for static magnetic-field-only control cells after inhibition of calcium signaling; see Fig. S4a for MAG and 5% images; SEM; n ≥ 150 from three exp.; ANOVA: p < 0.05, ∗∗p < 0.01; all scale bars, 5 μm. To see this figure in color, go online.
Figure 6
Figure 6
Lifeact imaging reveals opposing changes of actin reorganization at the cell and nuclear border during low-strain and high-strain cyclic stretch. MSFs were transfected with mRuby-Lifeact-7. The day after, cells were exposed to 30 min of 5 or 20% sinusoidal stretch, followed by 30 min of no stimulation (rest), during which image stacks were recorded. (a) Images of actin (Lifeact) or nuclei (H2b) recorded during the stretch routine are given. White dotted lines represent the center location of profile lines in (b); scale bars, 10 μm. (b) Projections of actin (Lifeact) and nuclear (H2b) profile lines, as indicated in (a), of two example cells before (0 min) or after (30 min) exposure to either 5 or 20% cyclic stretch are given. (c) Changes in Lifeact intensities after 30 min of stretch were binned into relative locations to compare changes in different cells: Bins 1–5 represent intensities from the nuclear center to the inner nuclear border and 6–10 from the nuclear periphery to the cell border. Lifeact intensities shifted from the cell border to the nuclear periphery after 20% cyclic stretch, whereas this trend was inversed after 5% cyclic stretch; SEM; n = 6; t-test (vs. 0 min): p < 0.05, ∗∗p < 0.01, ∗∗∗p < 0.001. (d) Changes in Lifeact intensities at the nuclear periphery (bin 6) and cell border (bin 10) over time. Actin reorganization shows dynamics similar to that of nuclear responses; SEM; n = 6; t-test (vs. 0 min): p < 0.05, ∗∗p < 0.01, ∗∗∗p < 0.001. To see this figure in color, go online.

References

    1. Engler A.J., Sen S., Discher D.E. Matrix elasticity directs stem cell lineage specification. Cell. 2006;126:677–689. - PubMed
    1. Engler A.J., Carag-Krieger C., Discher D.E. Embryonic cardiomyocytes beat best on a matrix with heart-like elasticity: scar-like rigidity inhibits beating. J. Cell Sci. 2008;121:3794–3802. - PMC - PubMed
    1. Pasqualini F.S., Agarwal A., Parker K.K. Traction force microscopy of engineered cardiac tissues. PLoS One. 2018;13:e0194706. - PMC - PubMed
    1. Hemphill M.A., Dauth S., Parker K.K. Traumatic brain injury and the neuronal microenvironment: a potential role for neuropathological mechanotransduction. Neuron. 2015;85:1177–1192. - PubMed
    1. Del Real A., Pérez-Campo F.M., Riancho J.A. Differential analysis of genome-wide methylation and gene expression in mesenchymal stem cells of patients with fractures and osteoarthritis. Epigenetics. 2017;12:113–122. - PMC - PubMed

Publication types