Establishment of a longitudinal pre-clinical model of lyssavirus infection
- PMID: 32407866
- PMCID: PMC8056983
- DOI: 10.1016/j.jviromet.2020.113882
Establishment of a longitudinal pre-clinical model of lyssavirus infection
Abstract
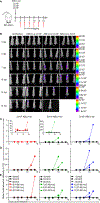
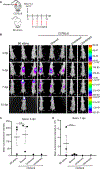
Traditional mouse models of lyssavirus pathogenesis rely on euthanizing large groups of animals at various time points post-infection, processing infected tissues, and performing histological and molecular analyses to determine anatomical sites of infection. While powerful by some measures, this approach is limited by the inability to monitor disease progression in the same mice over time. In this study, we established a novel non-invasive mouse model of lyssavirus pathogenesis, which consists of longitudinal imaging of a luciferase-expressing Australian bat lyssavirus (ABLV) reporter virus. In vivo bioluminescence imaging (BLI) in mice revealed viral spread from a peripheral site of inoculation into the central nervous system (CNS), with kinetically and spatially distinct foci of replication in the footpad, spinal cord, and hindbrain. Detection of virus within the CNS was associated with onset of clinical disease. Quantification of virus-derived luminescent signal in the brain was found to be a reliable measure of viral replication, when compared to traditional molecular methods. Furthermore, we demonstrate that in vivo imaging of ABLV infection is not restricted to the use of albino strains of mice, but rather strong BLI signal output can be achieved by shaving the hair from the heads and spines of pigmented strains, such as C57BL/6. Overall, our data show that in vivo BLI can be used to rapidly and non-invasively identify sites of lyssavirus replication and to semi-quantitatively determine viral load without the need to sacrifice mice at multiple time points.
Keywords: Bioluminescence imaging; CNS; Luciferase; Lyssavirus; Preclinical model.
Published by Elsevier B.V.
Conflict of interest statement
Declaration of Competing Interest None.
Figures


Similar articles
-
Longitudinal Tracing of Lyssavirus Infection in Mice via In Vivo Bioluminescence Imaging.Methods Mol Biol. 2022;2524:369-394. doi: 10.1007/978-1-0716-2453-1_30. Methods Mol Biol. 2022. PMID: 35821488
-
Pathogenesis studies with Australian bat lyssavirus in grey-headed flying foxes (Pteropus poliocephalus).Aust Vet J. 2002 Oct;80(10):636-41. doi: 10.1111/j.1751-0813.2002.tb10973.x. Aust Vet J. 2002. PMID: 12465817
-
Comparative pathogenesis of different phylogroup I bat lyssaviruses in a standardized mouse model.PLoS Negl Trop Dis. 2022 Jan 18;16(1):e0009845. doi: 10.1371/journal.pntd.0009845. eCollection 2022 Jan. PLoS Negl Trop Dis. 2022. PMID: 35041652 Free PMC article.
-
Emergence, Tropism, Disease, and Treatment of Australian Bat Lyssavirus Infections in Humans.Vector Borne Zoonotic Dis. 2023 Sep;23(9):486-494. doi: 10.1089/vbz.2022.0089. Epub 2023 Jun 19. Vector Borne Zoonotic Dis. 2023. PMID: 37335942 Review.
-
Australian bat lyssavirus: implications for public health.Med J Aust. 2014 Dec 11;201(11):647-9. doi: 10.5694/mja13.00261. Med J Aust. 2014. PMID: 25495308 Review.
Cited by
-
An in vivo BSL-2 model for henipavirus infection based on bioluminescence imaging of recombinant Cedar virus replication in mice.Front Chem Biol. 2024;3:1363498. doi: 10.3389/fchbi.2024.1363498. Epub 2024 Mar 18. Front Chem Biol. 2024. PMID: 38770087 Free PMC article.
-
mAb therapy controls CNS-resident lyssavirus infection via a CD4 T cell-dependent mechanism.EMBO Mol Med. 2023 Oct 11;15(10):e16394. doi: 10.15252/emmm.202216394. Epub 2023 Sep 28. EMBO Mol Med. 2023. PMID: 37767784 Free PMC article.
-
Longitudinal Tracing of Lyssavirus Infection in Mice via In Vivo Bioluminescence Imaging.Methods Mol Biol. 2022;2524:369-394. doi: 10.1007/978-1-0716-2453-1_30. Methods Mol Biol. 2022. PMID: 35821488
-
Isolation and Characterization of Cross-Reactive Human Monoclonal Antibodies That Potently Neutralize Australian Bat Lyssavirus Variants and Other Phylogroup 1 Lyssaviruses.Viruses. 2021 Mar 1;13(3):391. doi: 10.3390/v13030391. Viruses. 2021. PMID: 33804519 Free PMC article.
References
-
- Albertini AA, Ruigrok RW and Blondel D, 2011. Rabies virus transcription and replication. Adv Virus Res 79, 1–22. - PubMed
-
- Allworth A, Murray K and Morgan J, 1996. A human case of encephalitis due to a lyssavirus recently identified in fruit bats Communicable diseases intelligence 20.
-
- Annand EJ and Reid PA, 2014. Clinical review of two fatal equine cases of infection with the insectivorous bat strain of Australian bat lyssavirus. Aust Vet J 92, 324–32. - PubMed
Publication types
MeSH terms
Substances
Grants and funding
LinkOut - more resources
Full Text Sources

