

Inhibition of Microglial Activation in the Amygdala Reverses Stress-Induced Abdominal Pain in the Male Rat
- PMID: 32408032
- PMCID: PMC7394753
- DOI: 10.1016/j.jcmgh.2020.04.020
Inhibition of Microglial Activation in the Amygdala Reverses Stress-Induced Abdominal Pain in the Male Rat
Abstract
Background & aims: Psychological stress is a trigger for the development of irritable bowel syndrome and associated symptoms including abdominal pain. Although irritable bowel syndrome patients show increased activation in the limbic brain, including the amygdala, the underlying molecular and cellular mechanisms regulating visceral nociception in the central nervous system are incompletely understood. In a rodent model of chronic stress, we explored the role of microglia in the central nucleus of the amygdala (CeA) in controlling visceral sensitivity. Microglia are activated by environmental challenges such as stress, and are able to modify neuronal activity via synaptic remodeling and inflammatory cytokine release. Inflammatory gene expression and microglial activity are regulated negatively by nuclear glucocorticoid receptors (GR), which are suppressed by the stress-activated pain mediator p38 mitogen-activated protein kinases (MAPK).
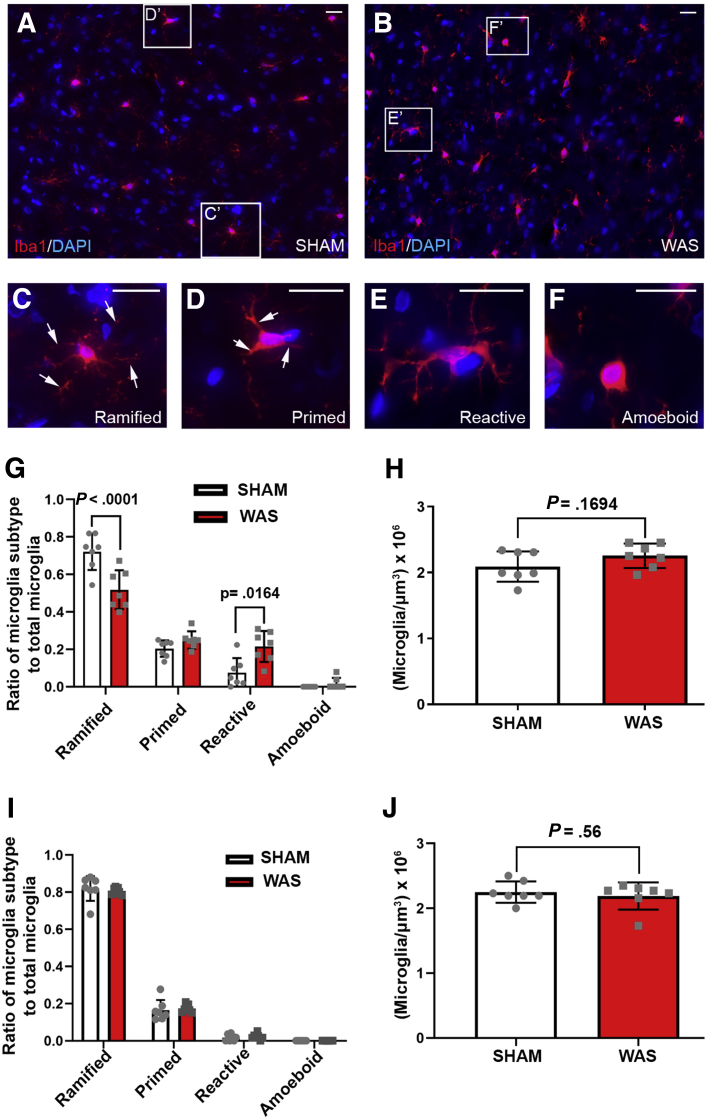
Methods: Fisher-344 male rats were exposed to water avoidance stress (WAS) for 1 hour per day for 7 days. Microglia morphology and the expression of phospho-p38 MAPK and GR were analyzed via immunofluorescence. Microglia-mediated synaptic remodeling was investigated by quantifying the number of postsynaptic density protein 95-positive puncta. Cytokine expression levels in the CeA were assessed via quantitative polymerase chain reaction and a Luminex assay (Bio-Rad, Hercules, CA). Stereotaxic infusion into the CeA of minocycline to inhibit, or fractalkine to activate, microglia was followed by colonic sensitivity measurement via a visceromotor behavioral response to isobaric graded pressures of tonic colorectal distension.
Results: WAS induced microglial deramification in the CeA. Moreover, WAS induced a 3-fold increase in the expression of phospho-p38 and decreased the ratio of nuclear GR in the microglia. The number of microglia-engulfed postsynaptic density protein 95-positive puncta in the CeA was increased 3-fold by WAS, while cytokine levels were unchanged. WAS-induced changes in microglial morphology, microglia-mediated synaptic engulfment in the CeA, and visceral hypersensitivity were reversed by minocycline whereas in stress-naïve rats, fractalkine induced microglial deramification and visceral hypersensitivity.
Conclusions: Our data show that chronic stress induces visceral hypersensitivity in male rats and is associated with microglial p38 MAPK activation, GR dysfunction, and neuronal remodeling in the CeA.
Keywords: Brain–Gut Axis; Chronic Psychological Stress; IBS; Visceral Hypersensitivity.
Copyright © 2020 The Authors. Published by Elsevier Inc. All rights reserved.
Figures


Similar articles
-
An enriched environment reduces chronic stress-induced visceral pain through modulating microglial activity in the central nucleus of the amygdala.Am J Physiol Gastrointest Liver Physiol. 2022 Feb 1;322(2):G223-G233. doi: 10.1152/ajpgi.00307.2021. Epub 2021 Dec 8. Am J Physiol Gastrointest Liver Physiol. 2022. PMID: 34877892 Free PMC article.
-
Amygdala microglia modify neuronal plasticity via complement C1q/C3-CR3 signaling and contribute to visceral pain in a rat model.Am J Physiol Gastrointest Liver Physiol. 2021 Jun 1;320(6):G1081-G1092. doi: 10.1152/ajpgi.00123.2021. Epub 2021 May 5. Am J Physiol Gastrointest Liver Physiol. 2021. PMID: 33949202
-
Environmental enrichment prevents chronic stress-induced brain-gut axis dysfunction through a GR-mediated mechanism in the central nucleus of the amygdala.Neurogastroenterol Motil. 2020 Jun;32(6):e13826. doi: 10.1111/nmo.13826. Epub 2020 Feb 21. Neurogastroenterol Motil. 2020. PMID: 32084303 Free PMC article.
-
Stress and visceral pain: focusing on irritable bowel syndrome.Pain. 2013 Dec;154 Suppl 1:S63-S70. doi: 10.1016/j.pain.2013.09.008. Epub 2013 Sep 8. Pain. 2013. PMID: 24021863 Review.
-
Corticotrophin-releasing factor 1 activation in the central amygdale and visceral hyperalgesia.Neurogastroenterol Motil. 2015 Jan;27(1):1-6. doi: 10.1111/nmo.12495. Neurogastroenterol Motil. 2015. PMID: 25557223 Free PMC article. Review.
Cited by
-
Differential Activation of Colonic Afferents and Dorsal Horn Neurons Underlie Stress-Induced and Comorbid Visceral Hypersensitivity in Female Rats.J Pain. 2021 Oct;22(10):1283-1293. doi: 10.1016/j.jpain.2021.04.004. Epub 2021 Apr 20. J Pain. 2021. PMID: 33887444 Free PMC article.
-
Olfactory Stimulation Successfully Modulates the Neurochemical, Biochemical and Behavioral Phenotypes of the Visceral Pain.Molecules. 2022 Nov 7;27(21):7659. doi: 10.3390/molecules27217659. Molecules. 2022. PMID: 36364487 Free PMC article.
-
SIRT1 activation attenuates microglia-mediated synaptic engulfment in postoperative cognitive dysfunction.Front Aging Neurosci. 2022 Nov 10;14:943842. doi: 10.3389/fnagi.2022.943842. eCollection 2022. Front Aging Neurosci. 2022. PMID: 36437988 Free PMC article.
-
An enriched environment reduces chronic stress-induced visceral pain through modulating microglial activity in the central nucleus of the amygdala.Am J Physiol Gastrointest Liver Physiol. 2022 Feb 1;322(2):G223-G233. doi: 10.1152/ajpgi.00307.2021. Epub 2021 Dec 8. Am J Physiol Gastrointest Liver Physiol. 2022. PMID: 34877892 Free PMC article.
-
Multi-omics for biomarker approaches in the diagnostic evaluation and management of abdominal pain and irritable bowel syndrome: what lies ahead.Gut Microbes. 2023 Jan-Dec;15(1):2195792. doi: 10.1080/19490976.2023.2195792. Gut Microbes. 2023. PMID: 37009874 Free PMC article. Review.
References
-
- Chey W.D., Kurlander J., Eswaran S. Irritable bowel syndrome: a clinical review. JAMA. 2015;313:949–958. - PubMed
-
- Price J.L. Comparative aspects of amygdala connectivity. Ann N Y Acad Sci. 2003;985:50–58. - PubMed
-
- Wilder-Smith C.H. The balancing act: endogenous modulation of pain in functional gastrointestinal disorders. Gut. 2011;60:1589–1599. - PubMed
Publication types
MeSH terms
Substances
Grants and funding
LinkOut - more resources
Full Text Sources
Medical
Research Materials
