. 2020 May 22;23(5):101112.
doi: 10.1016/j.isci.2020.101112. Epub 2020 Apr 30.

The Active Sensing of Control Difference

Affiliations

The Active Sensing of Control Difference

Wen Wen et al. iScience. .

Abstract

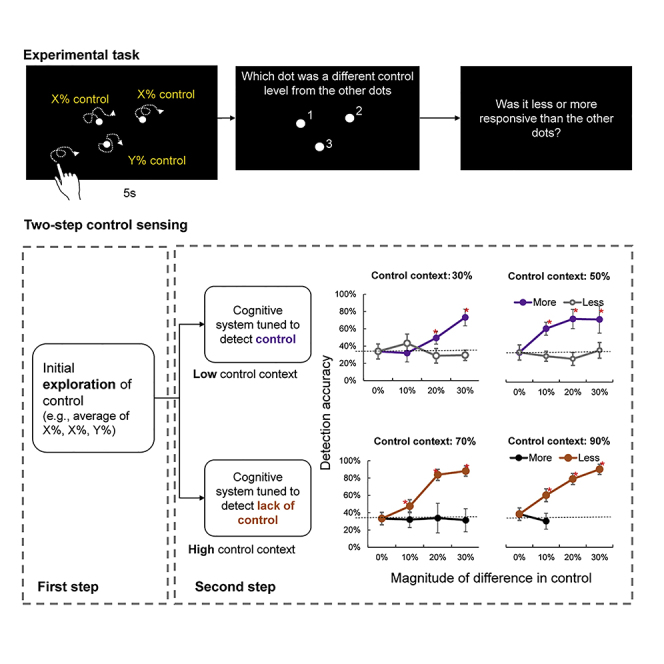
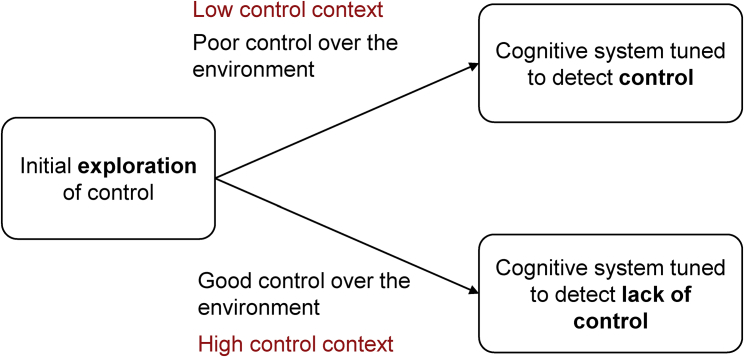
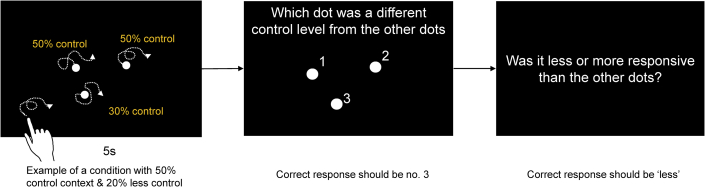
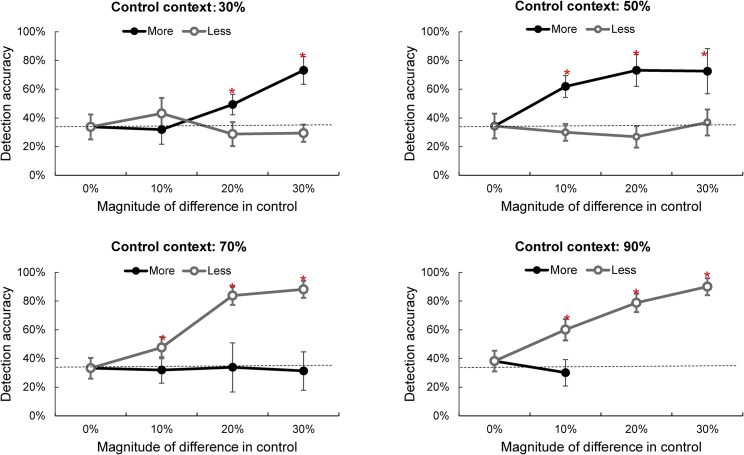
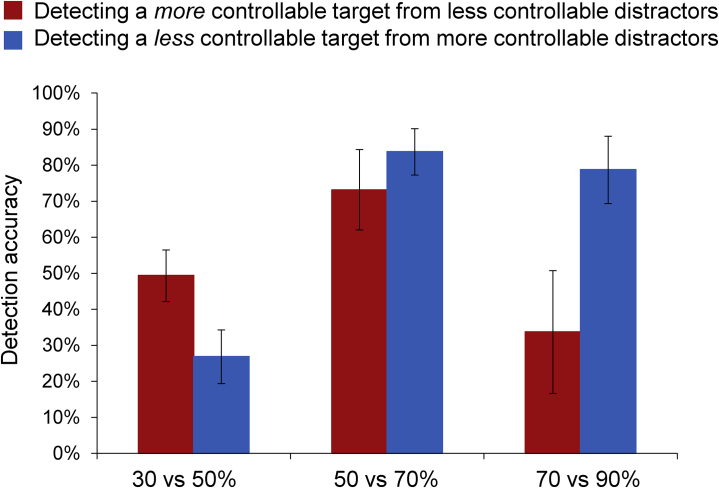
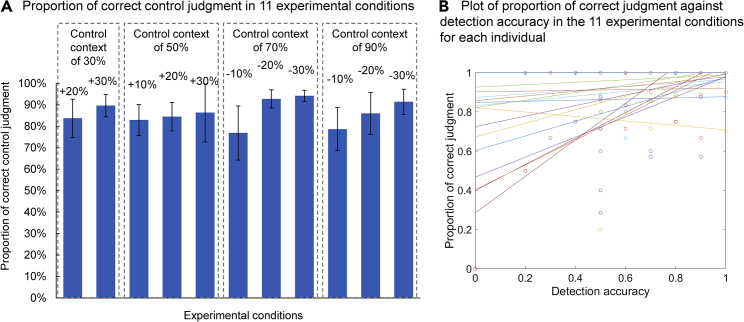
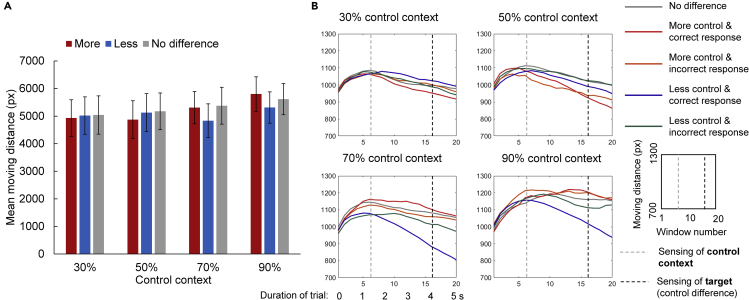
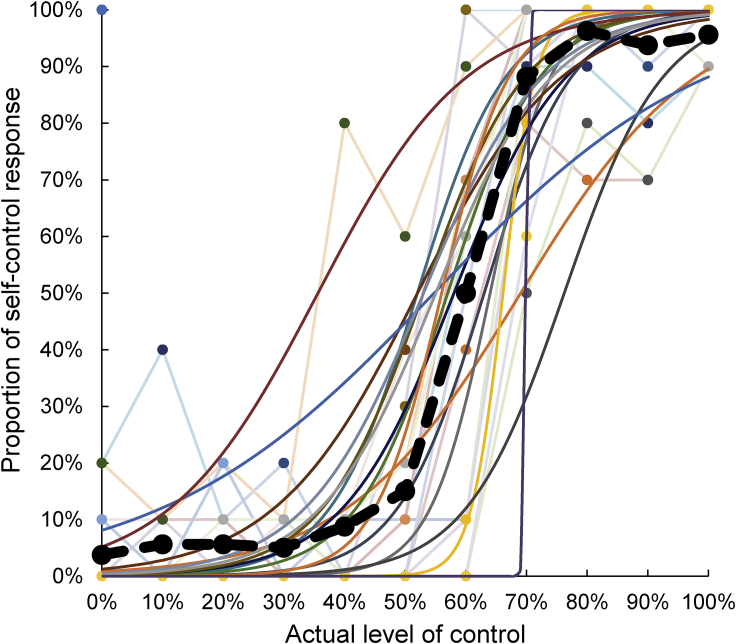
In everyday life, people control objects in the world around them to varying degrees. The processes people actively use to establish their control, while interacting with an environment containing large ambiguity, remain unknown. This study examines how people explore their control over the environment and how they detect small differences in control among objects. In the experimental task, participants moved three dots on a screen and identified one dot over which the level of control is different from that of the other two. The results support a two-step behavior mechanism underlying the sensing of control difference: People first explore their overall control in the environment, and then the results of the initial exploration are used to selectively tune the direction (i.e., either more or less) of the detected control difference, ensuring efficient and rapid detection of the type of control difference that is potentially important for further action selections.

Keywords: Behavioral Neuroscience; Cognitive Neuroscience; Neuroscience.


Conflict of interest statement

Declaration of Interests We declare no competing interests.

Figures

None
Graphical abstract
Figure 1
Figure 1
Hypothesis of Two-Step Control Sensing
Figure 2
Figure 2
Timeline of Control Difference Detection Task Yellow text shows levels of control over each dot in an example of one experimental condition, but this was not shown on the screen during the experiment.
Figure 3
Figure 3
Detection Accuracy for a Dot under a Different Level of Control (10%–30% more or less) than the Other Two Dots Red asterisks represent significant differences from chance level (i.e., dashed lines) (a Bonferroni-corrected significance level of .002 was used). Error bars represent 95% confidence intervals. ∗p < .002, one-sample t tests against 0.33.
Figure 4
Figure 4
Detection Accuracy in the Selected Experimental Conditions Red bars represent identification accuracies when the target was under more control than the distractors; blue bars represent identification accuracies when the target was under less control than the distractors. For example, in the 30% versus 50% condition, the red bar shows the detection accuracy when the target was 50% control and the distractors were under 30% control, whereas the blue bar shows the detection accuracy when the target was 30% control and the distractors were under 50% control. Error bars represent 95% confidence intervals.
Figure 5
Figure 5
Response on Direction of Control Difference (A) Proportion of correct responses on direction to the number of correct detection trials in the conditions when the participants' detection performance was better than chance level. Results show that, when participants correctly identified the target, they also had an explicit and correct sense of control over it. Error bars represent 95% confidence intervals. (B) Per-individual plot showing proportion of correct judgment against detection accuracy in the conditions when the participants' detection performance was better than chance level. Different colors represent individuals. Solid lines represent the results of linear regression for each individual.
Figure 6
Figure 6
Moving Distance of the Finger on the Touchpad (A) Total moving distance in each condition. Error bars represent 95% confidence intervals. (B) Moving distance in each sliding time window of 1 s at 0.2-s steps, depending on the control difference condition (no difference, more, or less) and response (correct or incorrect). Results show that a higher control context is linked to more movements, whereas correct detection of the target is linked to reduced movements. Vertical gray broken lines show the time window from which the main effect of control context emerged, indicating the sensing of control context. Vertical black broken lines show the time window from which the interaction between control context and trial type emerged, indicating the identification of the target (i.e., control difference).
Figure 7
Figure 7
Response and Logistic Fitted Curves in the Binary Control Judgment Task Colors represent individuals. Dots connected by lines represent the participants' responses, and curves represent the logistic fitting results. Black broken lines and black dots represent the mean proportion of Yes-responses (self-control response).

References

    1. Blakemore S.-J., Wolpert D.M., Frith C.D. Central cancellation of self-produced tickle sensation. Nat. Neurosci. 1998;1:635–640. - PubMed
    1. Blakemore S.-J., Frith C.D., Wolpert D.M. Spatio-temporal prediction modulates the perception of self-produced stimuli. J. Cogn. Neurosci. 1999;11:551–559. - PubMed
    1. Blakemore S.-J., Wolpert D.M., Frith C.D. Abnormalities in the awareness of action. Trends Cogn. Sci. 2002;6:237–242. - PubMed
    1. Eitam B., Kennedy P.M., Higgins E.T. Motivation from control. Exp. Brain Res. 2013;229:475–484. - PubMed
    1. Friston K., FitzGerald T., Rigoli F., Schwartenbeck P., O’Doherty J., Pezzulo G. Active inference and learning. Neurosci. Biobehav. Rev. 2016;68:862–879. - PMC - PubMed

LinkOut - more resources