. 2020 Jul;583(7816):469-472.
doi: 10.1038/s41586-020-2332-7. Epub 2020 May 14.

Proteomics of SARS-CoV-2-infected host cells reveals therapy targets

Affiliations

Proteomics of SARS-CoV-2-infected host cells reveals therapy targets

Denisa Bojkova et al. Nature. 2020 Jul.

Abstract

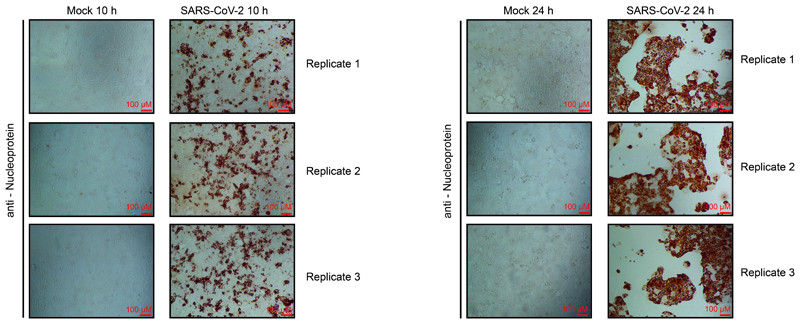
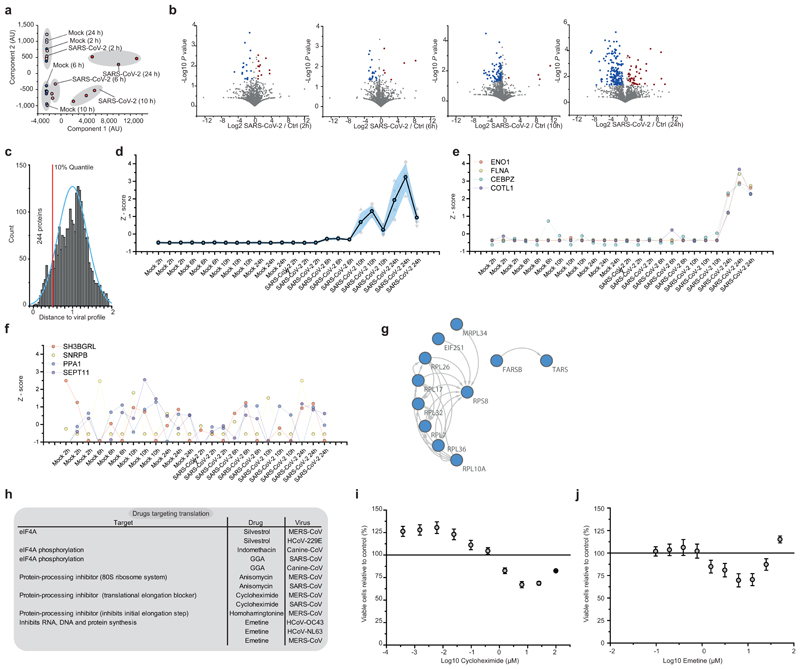
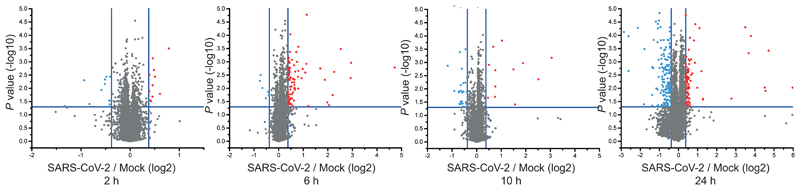
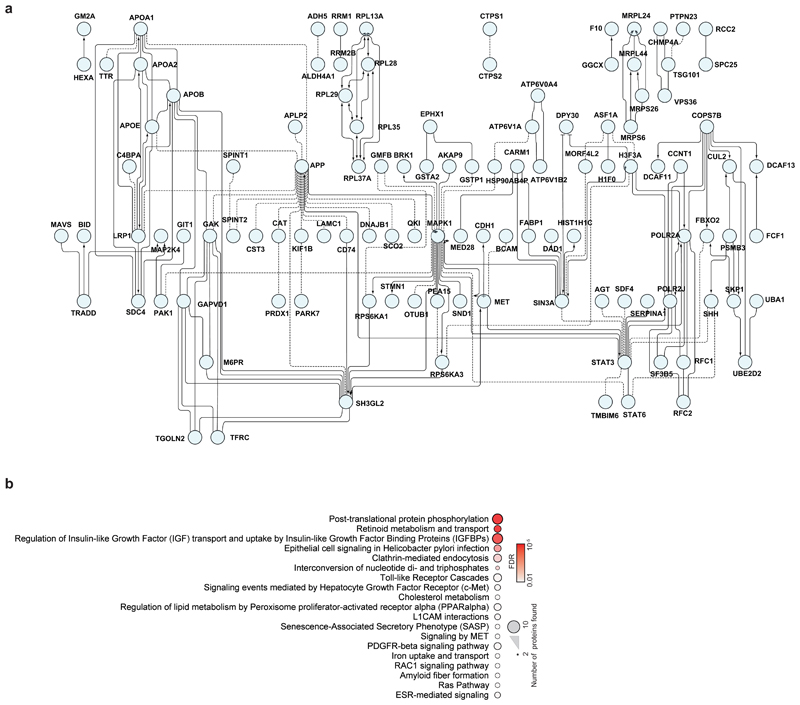
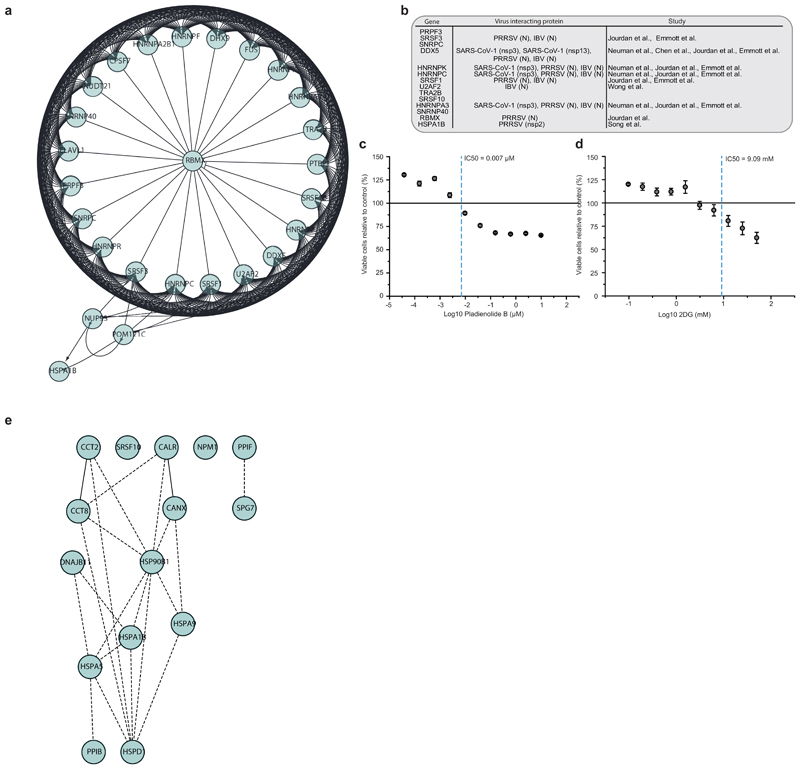
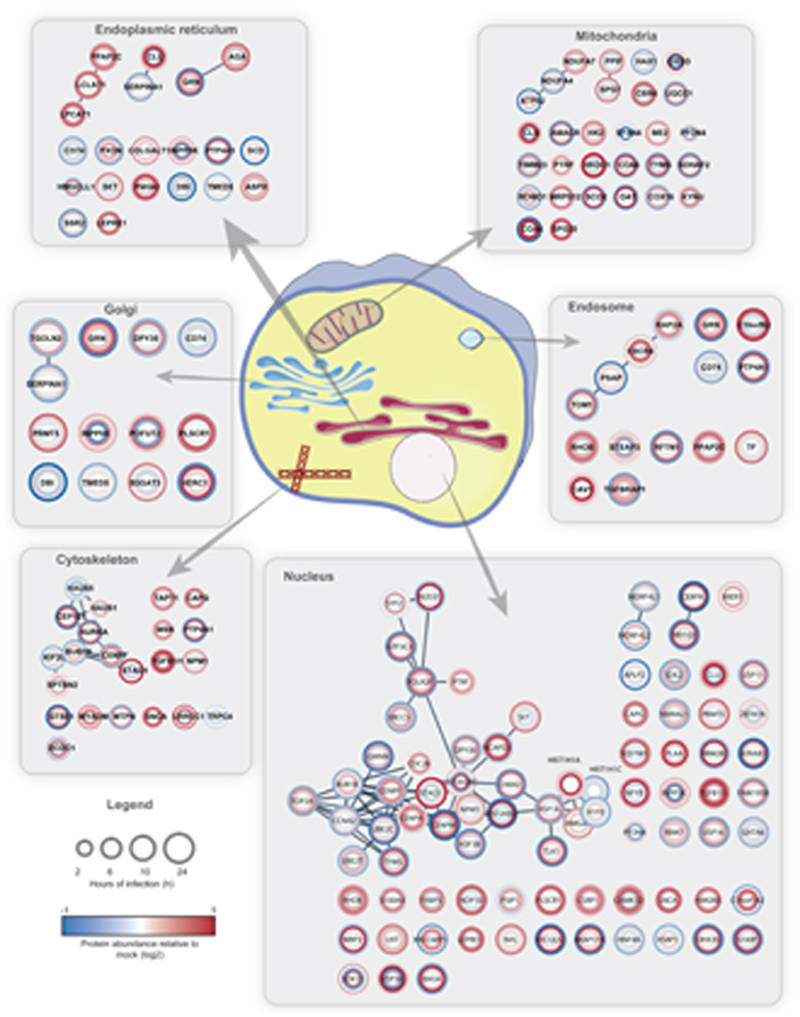
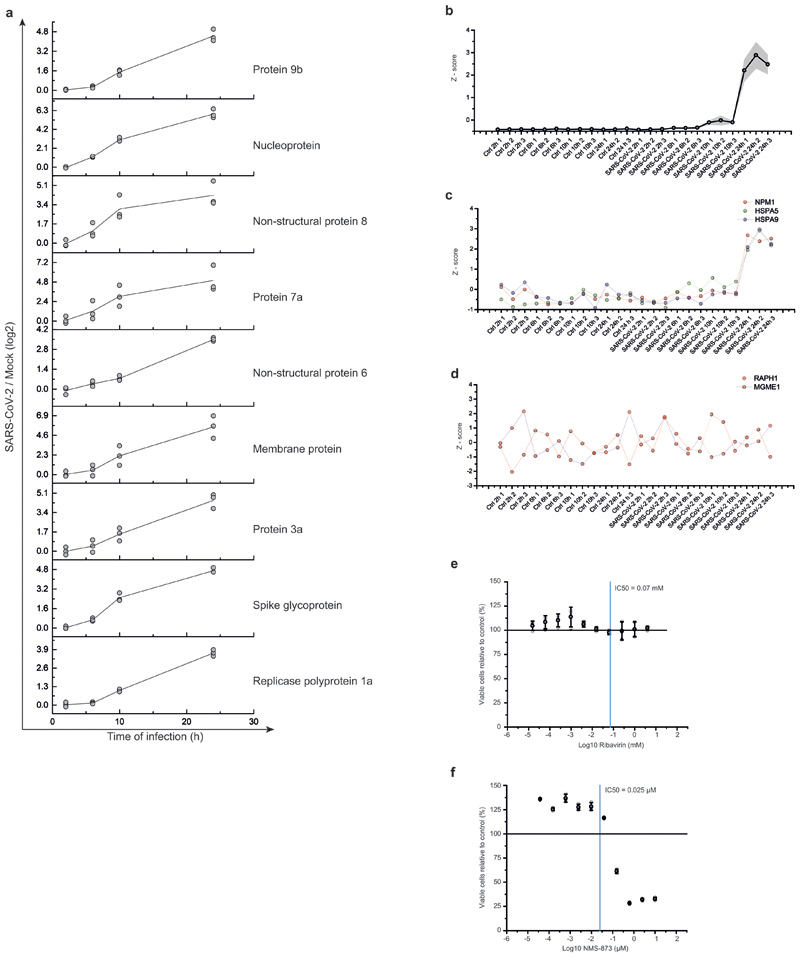
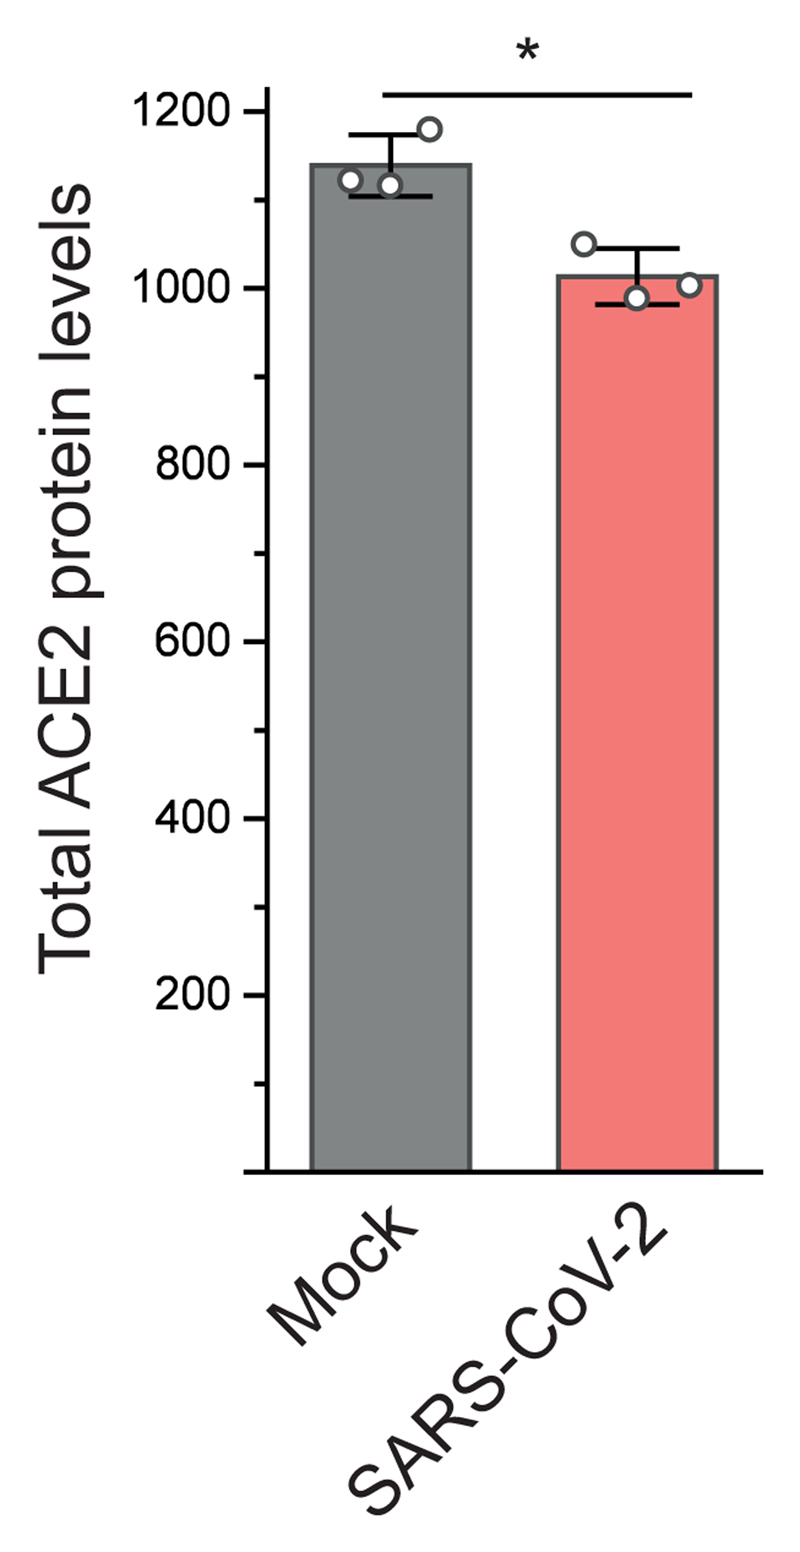
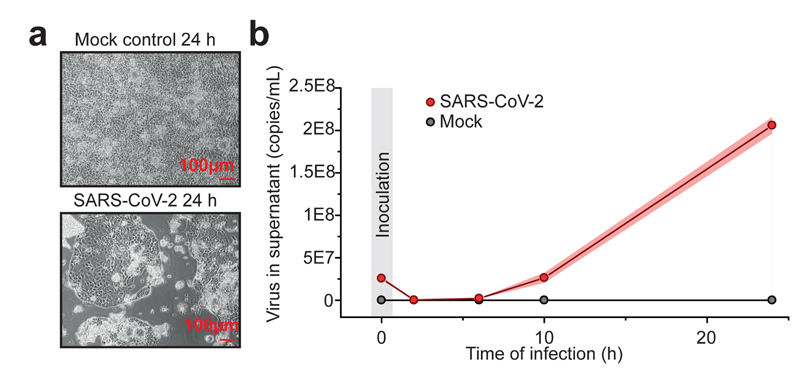
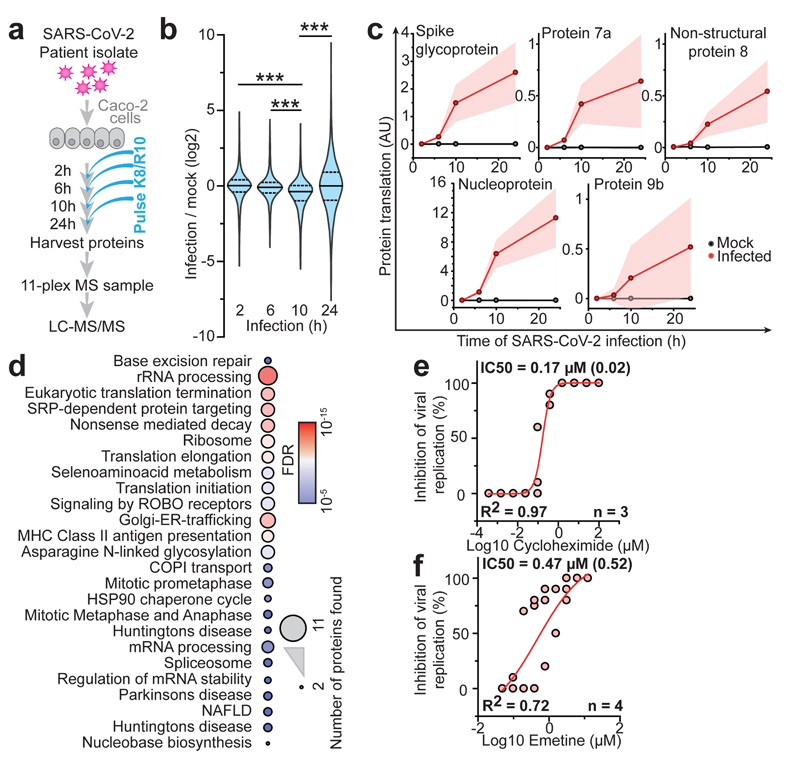
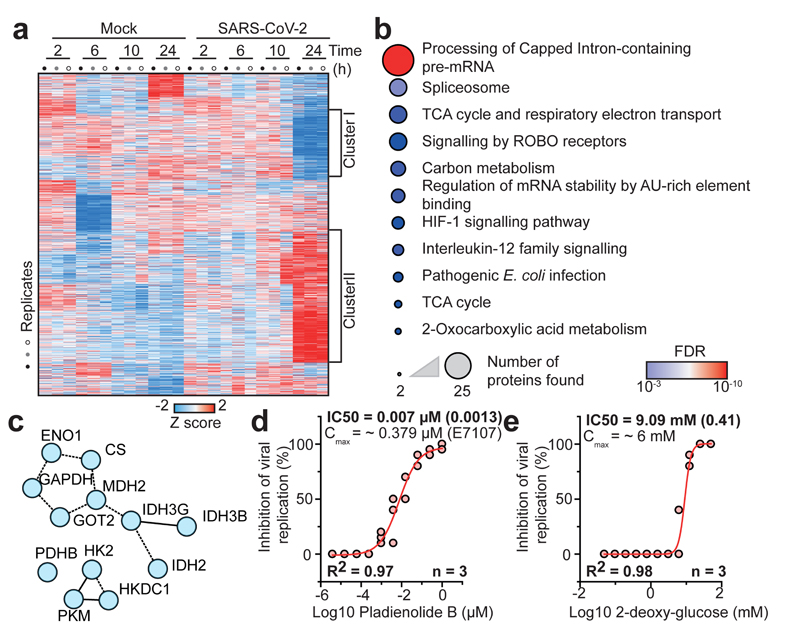
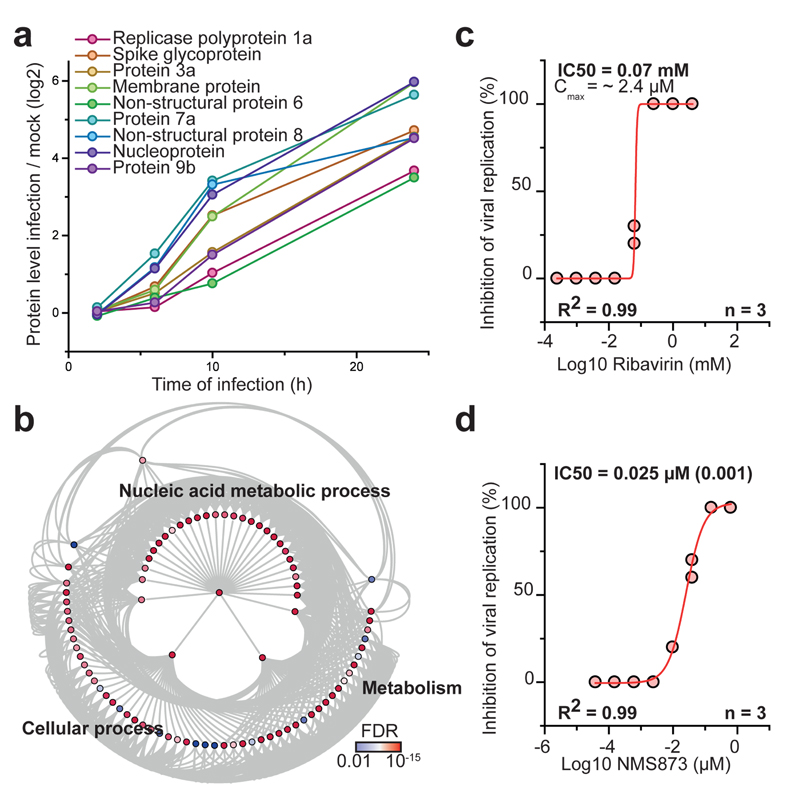
A new coronavirus was recently discovered and named severe acute respiratory syndrome coronavirus 2 (SARS-CoV-2). Infection with SARS-CoV-2 in humans causes coronavirus disease 2019 (COVID-19) and has been rapidly spreading around the globe1,2. SARS-CoV-2 shows some similarities to other coronaviruses; however, treatment options and an understanding of how SARS-CoV-2 infects cells are lacking. Here we identify the host cell pathways that are modulated by SARS-CoV-2 and show that inhibition of these pathways prevents viral replication in human cells. We established a human cell-culture model for infection with a clinical isolate of SARS-CoV-2. Using this cell-culture system, we determined the infection profile of SARS-CoV-2 by translatome3 and proteome proteomics at different times after infection. These analyses revealed that SARS-CoV-2 reshapes central cellular pathways such as translation, splicing, carbon metabolism, protein homeostasis (proteostasis) and nucleic acid metabolism. Small-molecule inhibitors that target these pathways prevented viral replication in cells. Our results reveal the cellular infection profile of SARS-CoV-2 and have enabled the identification of drugs that inhibit viral replication. We anticipate that our results will guide efforts to understand the molecular mechanisms that underlie the modulation of host cells after infection with SARS-CoV-2. Furthermore, our findings provide insights for the development of therapies for the treatment of COVID-19.


Conflict of interest statement

Competing interests

The authors declare no competing interests.

Figures

Extended Data Fig. 1
Extended Data Fig. 1. Viral protein accumulation in Caco-2 cells after SARS-CoV-2 infection.
Cells were infected with SARS-CoV-2 at a MOI of 1 and incubated for 10 or 24 hours. Cells were fixed and stained with an antibody for SARS-CoV-2 nucleoprotein, followed by peroxidase conjugated secondary antibody and addition of substrate. Shown are three independent biological samples. n = 3 independent biological samples.
Extended Data Fig. 2
Extended Data Fig. 2. Translatome analysis of cells infected with SARS-CoV-2.
a, Principal component analysis of all replicate translatome measurements. Blue dots represent different mock controls, red dots different SARS-CoV-2 infected samples. b, Volcano plots showing differentially translated genes between infected cells and mock control group for each time point. Log2 fold changes are plotted against P values (two sided unpaired t-test with equal variance assumed; n = 3 independent biological samples). Blue dots indicate significant decrease in translation (FC < -0.5, P value < 0.05), red dots indicate significant increase in translation (FC > 0.5, P value < 0.05 c, Histogram of distances of host protein expression profile to viral proteins. Viral protein translation profiles were Z scored, averaged (5 viral proteins) and used as reference profile to compare to each host protein in dataset. The blue curve shows a distribution curve fitted to data, the red line indicates top 10% quantile of distances used for pathway analysis (in Fig. 2). d, Averaged viral protein translation Z-score profile over all replicate samples (5 viral proteins). Grey shade indicates SD of averaged profiles, coloured profiles in the background represent individual viral proteins. e, Translation Z score profiles for four example proteins (ENO1, FLNA, CEBPZ and COTL1) following viral profile from c. f, Translation Z score profiles for four example proteins (SH3BGRL, sNRPB, PPA1 and SEPT11) that do not follow viral reference profile. g, Network of functional interactions between proteins annotated with function in host translation. Arrows indicate functional interaction. h, Drugs targeting host translation that have been used in vitro for treatment of other (i.e. non-SARS-CoV-2) coronavirus infections. i, j, Cytotoxicity assays for different concentrations of cycloheximide (i) and emetine (j) relative to control. Mean values ± s.d. are plotted (n = 3 independent biological samples). Line represents 100% viable cells.
Extended Data Fig. 3
Extended Data Fig. 3. Volcano plots of total protein level change over time.
P values have been calculated using a two-sided, unpaired student’s t-test with equal variance assumed and were plotted against the log2 ratio between SARS-CoV-2 infected and mock cells for each time-point (n = 3 independent biological samples).
Extended Data Fig. 4
Extended Data Fig. 4. Network of proteins decreased during SARS-CoV-2 infection.
a, Proteins belonging to cluster I in Fig. 3a were used for functional interaction network creation. Lines indicate functional interactions. The network was created using the ReactomeFI plugin in cytoscape, protein names added in the plugin and the network adjusted by the yFiles Layout algorithm. b, ReactomeFI network analysis of proteins downregulated in total protein levels. Circle size represents number of proteins found in the pathway, colour shows FDR for enrichment.
Extended Data Fig. 5
Extended Data Fig. 5. Networks of proteins increased during infection.
a, Network of proteins increased during infection with spliceosome annotation in Reactome pathway analysis. Lines indicate functional interaction. b, Table summarising viral proteins (from different coronaviruses) interacting with various spliceosome components. c, d, Cytotoxicity assays for different concentrations of Pladienolide B (c) and 2-deoxy-glucose (d) relative to control. Mean values ± s.d. (n = 3 independent biological samples). Line represents 100% viable cells. e, Protein network showing increased proteins during infection with annotation to “unfolded protein binding” molecular function. Lines indicate functional interaction
Extended Data Fig. 6
Extended Data Fig. 6. Compartment analysis of proteins significantly regulated.
STRING network was created with proteins filtered for significant changes in protein levels (FC log2 > |0.35|, P value < 0.05) and filtered for each compartment (Cutoff maximum [5]). Circle heatmaps represent log2 ratios between infected and mock cells at different timepoints of infection starting at the innermost circle (2 hours) towards the outer circle (24 h).
Extended Data Fig. 7
Extended Data Fig. 7. Viral protein profiles and cytotoxicity assay for nucleic acid and p97 inhibitors.
a, Total protein profiles for each viral protein with individual replicate measurements to indicate variation. Log2 ratios of infected versus mock cells are plotted against time of infection. Line indicates averaged curve (n = 3 independent biological samples) and dots represent individual measurements. b, Averaged reference profile of total protein levels for all viral proteins from a(9 viral proteins). Shade indicates s.d.. c, Example profiles of three proteins (NPM1, HSPA5 and HSPA9) significantly following the viral reference profile. d, Example profiles of proteins (RAPH1, MGME1) not following the viral reference profile. e, f, Cytotoxicity assays for different concentrations of Ribavirin (e) and NSM-873 (f) relative to control. Mean values ± s.d. are plotted (n = 3 independent biological samples). Line represents 100% viable cells.
Extended Data Fig. 8
Extended Data Fig. 8. ACE2 total protein levels after 24 hours of infection.
Total ACE2 protein levels 24 hours after infection compared to mock samples (n = 3 independent biological samples). Significance was assessed by an unpaired, two-sided student´s t-test. * P value < 0.05.
Fig. 1
Fig. 1. SARS-CoV-2 replication model in in human cells.
a,Caco-2 cells were either mock or SARS-CoV-2 infected and cultured for 24 h. Microscopy pictures were taken to demonstrate cytopathic effect. Scale bars indicate 100 µm. Representative pictures from three independent biological replicates are shown. b, Quantitative PCR analysis of viral genome copies per mL cell culture after indicated infection time points (n = 3 independent biological samples). Points indicate mean of replicate measurements and shades represent s.d..
Fig. 2
Fig. 2. Host cell translation changes upon SARS-CoV-2 infection.
a, Experimental scheme for translatome and proteome measurements. Caco-2 cells were infected with SARS-CoV-2 isolated from patients, incubated as indicated and analysed by quantitative translation and whole-cell proteomics. b, Global translation rates, showed by distribution plots of mean fold changes (log2) of replicates to mock control for each time point and protein. Black line indicates median and dashed lines indicate 25%/75% quantiles. Significance was tested by one-way ANOVA and two-sided post-hoc Bonferroni test. *** P value < 0.001 (10h/2h: 4x10-26; 10h/6h: 2.4x10⁻²³; 10h/24h: 2.3x10⁻²⁸, n = 2,716 measured proteins averaged from 3 independent biological samples). c, Translation of viral proteins over time. Mean translation in AU (normalised and corrected summed PSMs were averaged) is plotted for control and infected samples. Shades indicate s.d. (n = 3). d, Reactome pathway analysis of top 10% proteins following viral gene expression. Pathway results are shown with number of proteins found in dataset and computed FDR for pathway enrichment. e, f, Antiviral assay showing inhibition of viral replication in dependency of cycloheximide (e, n = 3) and emetine (f, n = 4) concentration. Each data point indicates biological replicates and red line shows dose response curve fit. R2 and IC50 values were computed from the curve fit and SD of IC50 is indicated in brackets. All n numbers represent independent biological samples if not stated otherwise.
Fig. 3
Fig. 3. SARS-CoV-2 infection profiling reveals cellular pathways essential for replication.
a, Patterns of protein levels across all samples. Shown are proteins tested significant (two-sided, unpaired t-test with equal variance assumed, P < 0.05, n = 3) in at least one infected sample compared to corresponding control. Data was standardized using Z scoring before row-wise clustering and plotting. b, Reactome pathway analysis of protein network created from cluster II (a, see Table S4). Pathway results are shown with number of proteins found in dataset and computed FDR for pathway enrichment. c, Functional interaction network of proteins found annotated to carbon metabolism in Reactome pathway analysis. Lines indicate functional interaction. d, e, Antiviral assay showing inhibition of viral replication in dependency of pladienolide B (d, n = 3) and 2-deoxy-glucose (e, n = 3) concentration. Each data point indicates a biological replicate and red line shows dose response curve fit. R2 and IC50 values were computed from the curve fit and s.d. of IC50 is indicated in brackets. All n numbers represent independent biological samples.
Fig. 4
Fig. 4. Inhibition of host cell pathways induced upon infection prevent SARS-CoV-2 replication.
a, Protein levels of all detected viral proteins are plotted with their log2 changes to corresponding control for different infection times. Mean fold changes are plotted (n = 3). b, Gene ontology network analysis of host proteins correlating with viral protein expression (FDR < 0.01). Proteins were clustered for biological process GO term and plotted as network with FDR colour coding. Annotated pathways represent parent pathways in the network. c, d, Antiviral assay showing inhibition of viral replication in dependency of Ribavirin (c, n = 3) and NMS873 (d, n = 3) concentration. Each data point indicates a biological replicate and red line indicates dose response curve fit. R2 and IC50 values were computed from the curve fit and s.d. of IC50 is indicated in brackets. All n numbers represent independent biological samples.

References

    1. Zhu N, et al. A Novel Coronavirus from Patients with Pneumonia in China, 2019. N Engl J Med. 2020;382:727–733. doi: 10.1056/NEJMoa2001017. - DOI - PMC - PubMed
    1. Zhao S, et al. Preliminary estimation of the basic reproduction number of novel coronavirus (2019-nCoV) in China, from 2019 to 2020: A data-driven analysis in the early phase of the outbreak. Int J Infect Dis. 2020 doi: 10.1016/j.ijid.2020.01.050. - DOI - PMC - PubMed
    1. Klann K, Tascher G, Münch C. Functional Translatome Proteomics Reveal Converging and Dose-Dependent Regulation by mTORC1 and eIF2α. Mol Cell. 2020;77:913–925.e4. doi: 10.1016/j.molcel.2019.11.010. - DOI - PMC - PubMed
    1. Jin Y-H, et al. A rapid advice guideline for the diagnosis and treatment of 2019 novel coronavirus (2019-nCoV) infected pneumonia (standard version) Mil Med Res. 2020;7:4. doi: 10.1186/s40779-020-0233-6. - DOI - PMC - PubMed
    1. She J, et al. 2019 novel coronavirus of pneumonia in Wuhan, China: emerging attack and management strategies. Clin Transl Med. 2020;9:1–7. doi: 10.1186/s40169-020-00271-z. - DOI - PMC - PubMed

Publication types

MeSH terms