

Effects of temperature variation and humidity on the death of COVID-19 in Wuhan, China
- PMID: 32408453
- PMCID: PMC7142681
- DOI: 10.1016/j.scitotenv.2020.138226
Effects of temperature variation and humidity on the death of COVID-19 in Wuhan, China
Abstract
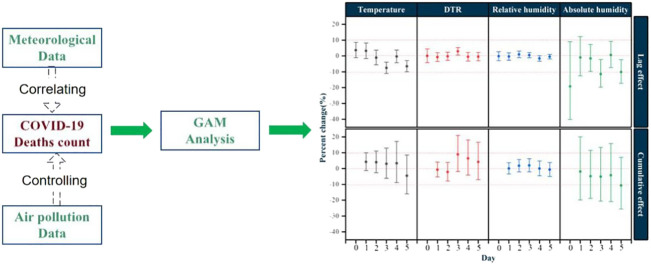
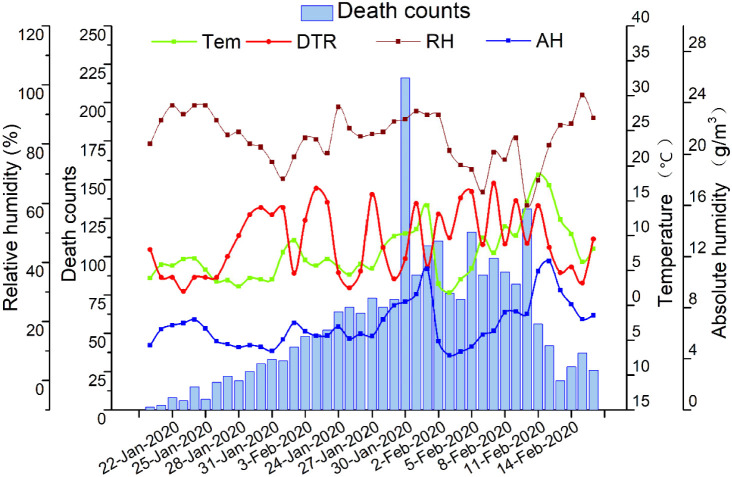
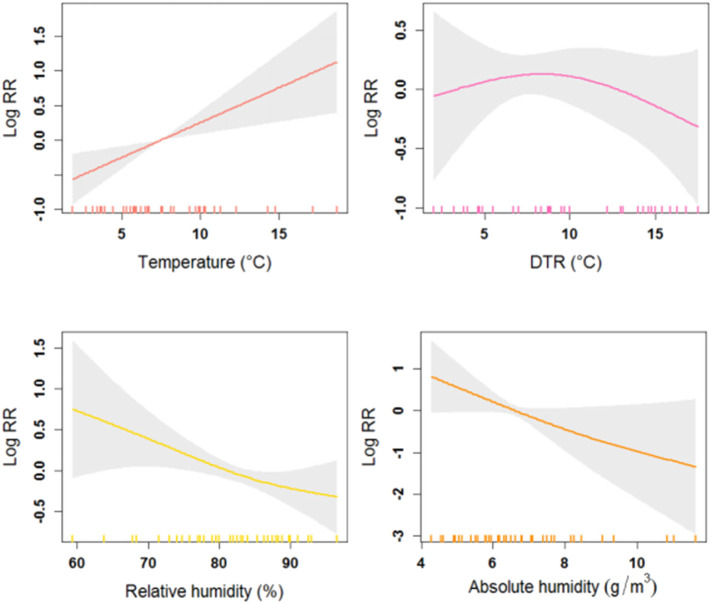
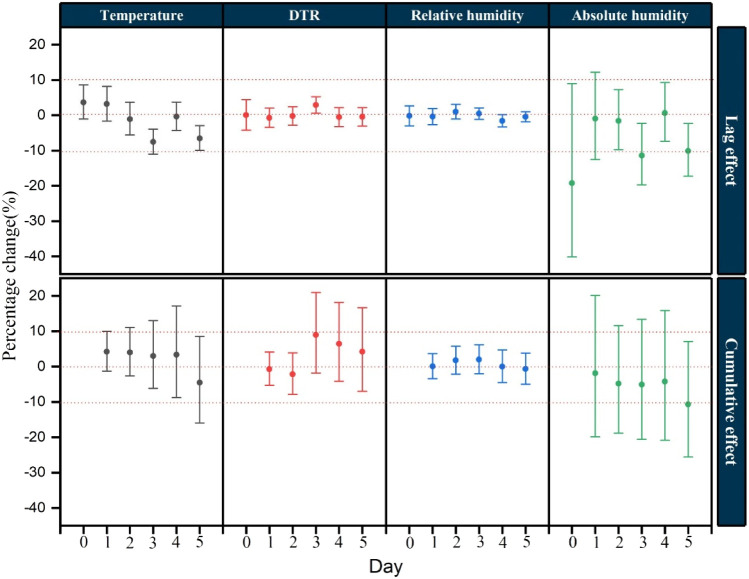
Meteorological parameters are the important factors influencing the infectious diseases such as severe acute respiratory syndrome (SARS) and influenza. This study aims to explore the association between Corona Virus Disease 2019 (COVID-19) deaths and weather parameters. In this study, we collected the daily death numbers of COVID-19, meteorological parameters and air pollutant data from 20 January 2020 to 29 February 2020 in Wuhan, China. Generalized additive model was applied to explore the effect of temperature, humidity and diurnal temperature range on the daily death counts of COVID-19. There were 2299 COVID-19 death counts in Wuhan during the study period. A positive association with COVID-19 daily death counts was observed for diurnal temperature range (r = 0.44), but negative association for relative humidity (r = -0.32). In addition, one unit increase in diurnal temperature range was only associated with a 2.92% (95% CI: 0.61%, 5.28%) increase in COVID-19 deaths in lag 3. However, both 1 unit increase of temperature and absolute humidity were related to the decreased COVID-19 death in lag 3 and lag 5, with the greatest decrease both in lag 3 [-7.50% (95% CI: -10.99%, -3.88%) and -11.41% (95% CI: -19.68%, -2.29%)]. In summary, this study suggests the temperature variation and humidity may also be important factors affecting the COVID-19 mortality.
Keywords: COVID-19; Diurnal temperature range; Generalized additive model; Humidity; Temperature.
Copyright © 2020 Elsevier B.V. All rights reserved.
Conflict of interest statement
Declaration of competing interest The authors declare that they have no conflict of interest.
Figures
References
-
- Anon. Vol. 2020. 2019. Wuhan Statistical Yearbook 2018.
MeSH terms
LinkOut - more resources
Full Text Sources
Medical
Miscellaneous
