

An Innovative Lipidomic Workflow to Investigate the Lipid Profile in a Cystic Fibrosis Cell Line
- PMID: 32408521
- PMCID: PMC7291020
- DOI: 10.3390/cells9051197
An Innovative Lipidomic Workflow to Investigate the Lipid Profile in a Cystic Fibrosis Cell Line
Abstract
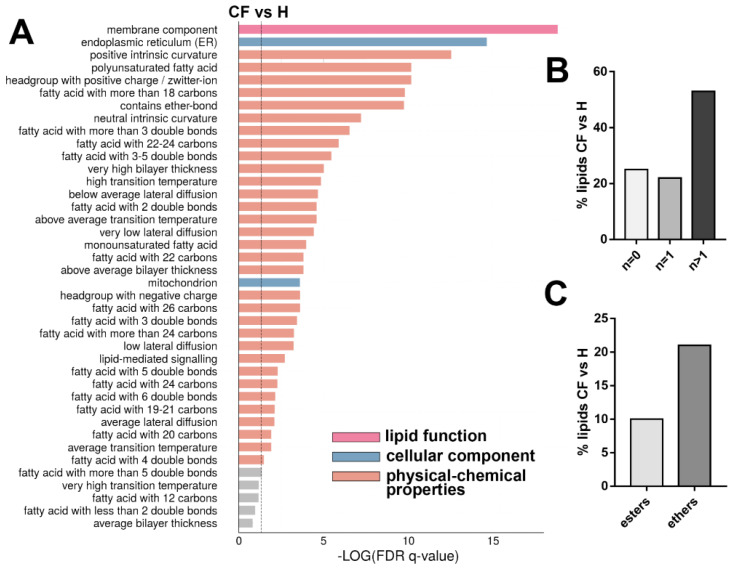
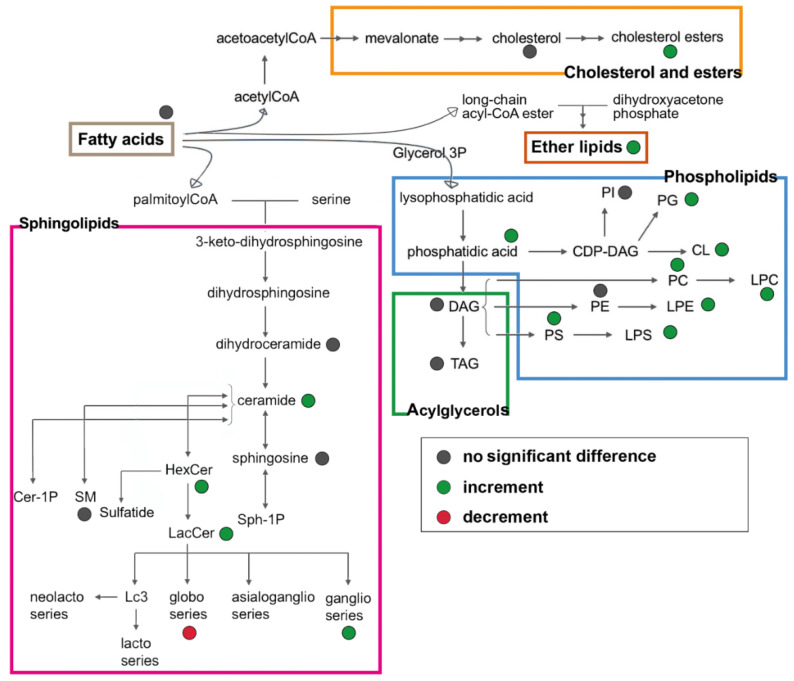
Altered lipid metabolism has been associated to cystic fibrosis disease, which is characterized by chronic lung inflammation and various organs dysfunction. Here, we present the validation of an untargeted lipidomics approach based on high-resolution mass spectrometry aimed at identifying those lipid species that unequivocally sign CF pathophysiology. Of n.13375 mass spectra recorded on cystic fibrosis bronchial epithelial airways epithelial cells IB3, n.7787 presented the MS/MS data, and, after software and manual validation, the final number of annotated lipids was restricted to n.1159. On these lipids, univariate and multivariate statistical approaches were employed in order to select relevant lipids for cellular phenotype discrimination between cystic fibrosis and HBE healthy cells. In cystic fibrosis IB3 cells, a pervasive alteration in the lipid metabolism revealed changes in the classes of ether-linked phospholipids, cholesterol esters, and glycosylated sphingolipids. Through functions association, it was evidenced that lipids variation involves the moiety implicated in membrane composition, endoplasmic reticulum, mitochondria compartments, and chemical and biophysical lipids properties. This study provides a new perspective in understanding the pathogenesis of cystic fibrosis and strengthens the need to use a validated mass spectrometry-based lipidomics approach for the discovery of potential biomarkers and perturbed metabolism.
Keywords: OMICS; biomarker; cell structure; cystic fibrosis; lipidomics; membrane composition; sphingolipid; untargeted analysis.
Conflict of interest statement
The authors declare no conflicts of interest.
Figures
Similar articles
-
Inhibition of Sphingolipid Synthesis as a Phenotype-Modifying Therapy in Cystic Fibrosis.Cell Physiol Biochem. 2020 Jan 31;54(1):110-125. doi: 10.33594/000000208. Cell Physiol Biochem. 2020. PMID: 31999897
-
Lavage lipidomics signatures in children with cystic fibrosis and protracted bacterial bronchitis.J Cyst Fibros. 2019 Nov;18(6):790-795. doi: 10.1016/j.jcf.2019.04.012. Epub 2019 Apr 25. J Cyst Fibros. 2019. PMID: 31029606
-
Myriocin modulates the altered lipid metabolism and storage in cystic fibrosis.Cell Signal. 2021 May;81:109928. doi: 10.1016/j.cellsig.2021.109928. Epub 2021 Jan 19. Cell Signal. 2021. PMID: 33482299
-
Lipidomics in autoimmune diseases with main focus on systemic lupus erythematosus.J Pharm Biomed Anal. 2019 Sep 10;174:386-395. doi: 10.1016/j.jpba.2019.06.005. Epub 2019 Jun 6. J Pharm Biomed Anal. 2019. PMID: 31207360 Review.
-
Lipid metabolism in cystic fibrosis.Curr Opin Clin Nutr Metab Care. 2009 Mar;12(2):105-9. doi: 10.1097/mco.0b013e32832595b7. Curr Opin Clin Nutr Metab Care. 2009. PMID: 19209467 Review.
Cited by
-
Lipidomics in Understanding Pathophysiology and Pharmacologic Effects in Inflammatory Diseases: Considerations for Drug Development.Metabolites. 2022 Apr 7;12(4):333. doi: 10.3390/metabo12040333. Metabolites. 2022. PMID: 35448520 Free PMC article. Review.
-
Spns2 Transporter Contributes to the Accumulation of S1P in Cystic Fibrosis Human Bronchial Epithelial Cells.Biomedicines. 2021 Aug 31;9(9):1121. doi: 10.3390/biomedicines9091121. Biomedicines. 2021. PMID: 34572307 Free PMC article.
-
Inhibition of Ceramide Synthesis Reduces α-Synuclein Proteinopathy in a Cellular Model of Parkinson's Disease.Int J Mol Sci. 2021 Jun 16;22(12):6469. doi: 10.3390/ijms22126469. Int J Mol Sci. 2021. PMID: 34208778 Free PMC article.
-
Redox Imbalance in Cystic Fibrosis: The Multifaceted Role of Oxidative Stress.Pharmaceuticals (Basel). 2025 May 24;18(6):784. doi: 10.3390/ph18060784. Pharmaceuticals (Basel). 2025. PMID: 40573184 Free PMC article. Review.
-
Evaluation of Dose-Response Relationship of Permeation Enhancer Isopropyl Myristate Release on Drug Release: Release Enhancement Efficiency and Molecular Mechanism.AAPS PharmSciTech. 2023 Dec 19;25(1):1. doi: 10.1208/s12249-023-02713-6. AAPS PharmSciTech. 2023. PMID: 38114839
References
-
- Tang Q.Q. Lipid metabolism and diseases. Sci. Bull. 2016;61:1471–1472. doi: 10.1007/s11434-016-1174-z. - DOI
