. 2020 Jun;245(11):983-993.
doi: 10.1177/1535370220919364. Epub 2020 May 14.

Valsartan ameliorates high glucose-induced peritoneal fibrosis by blocking mTORC1 signaling

Affiliations

Valsartan ameliorates high glucose-induced peritoneal fibrosis by blocking mTORC1 signaling

Jing Liu et al. Exp Biol Med (Maywood). 2020 Jun.

Abstract

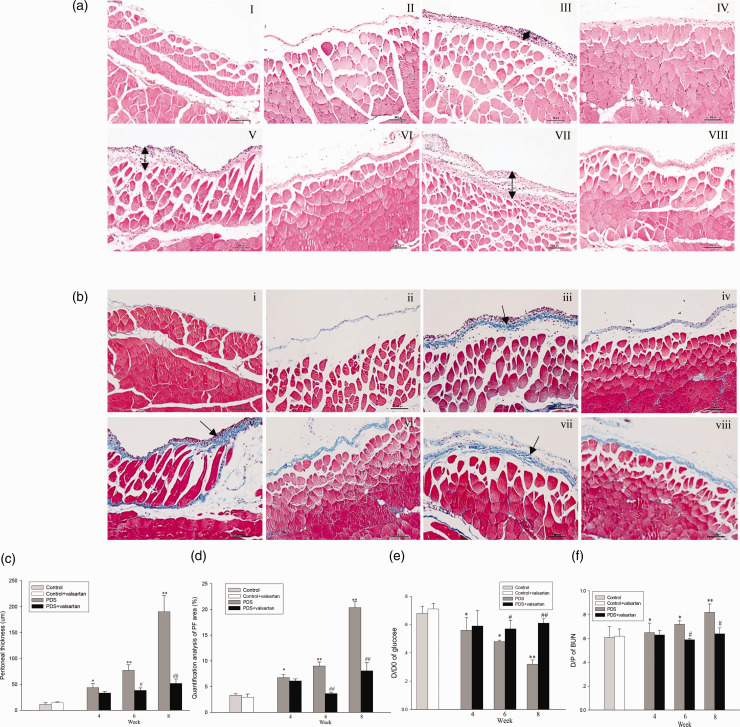
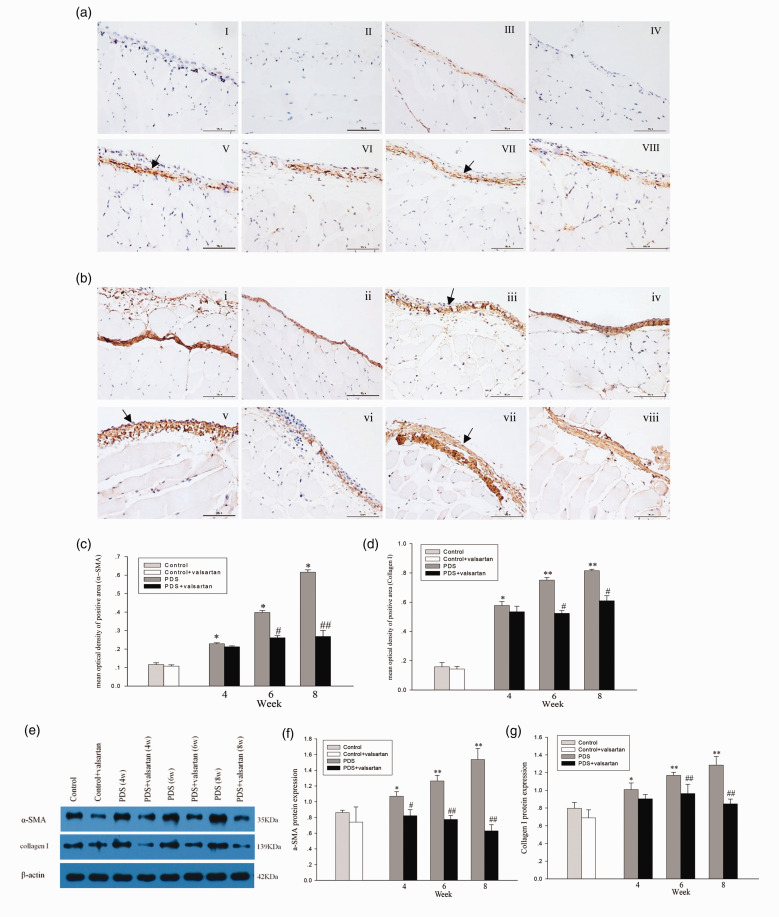
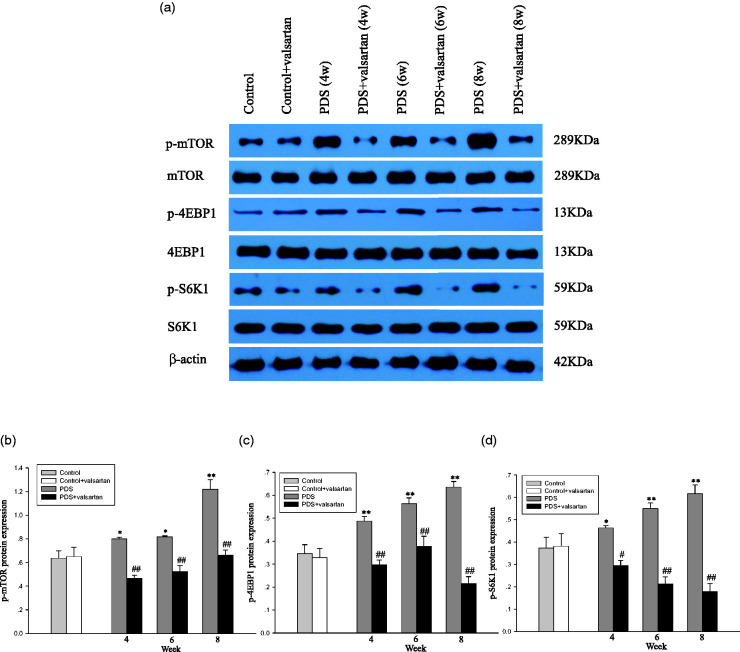
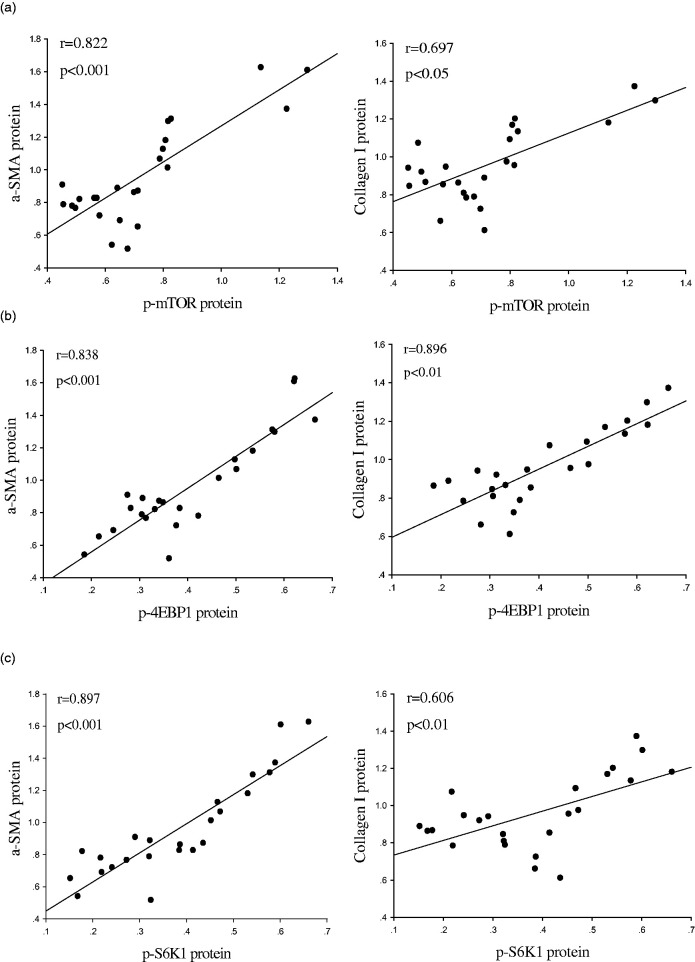
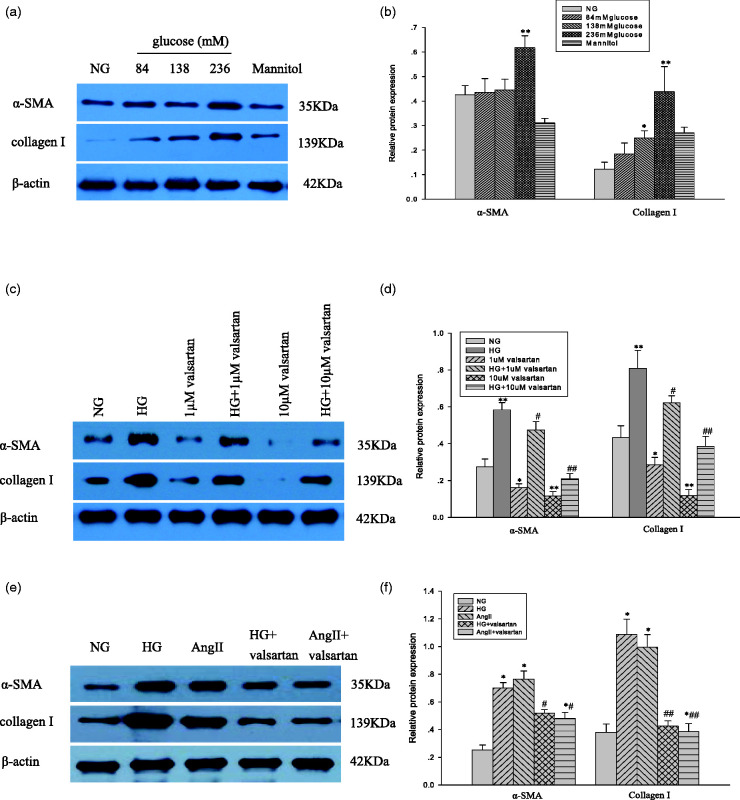
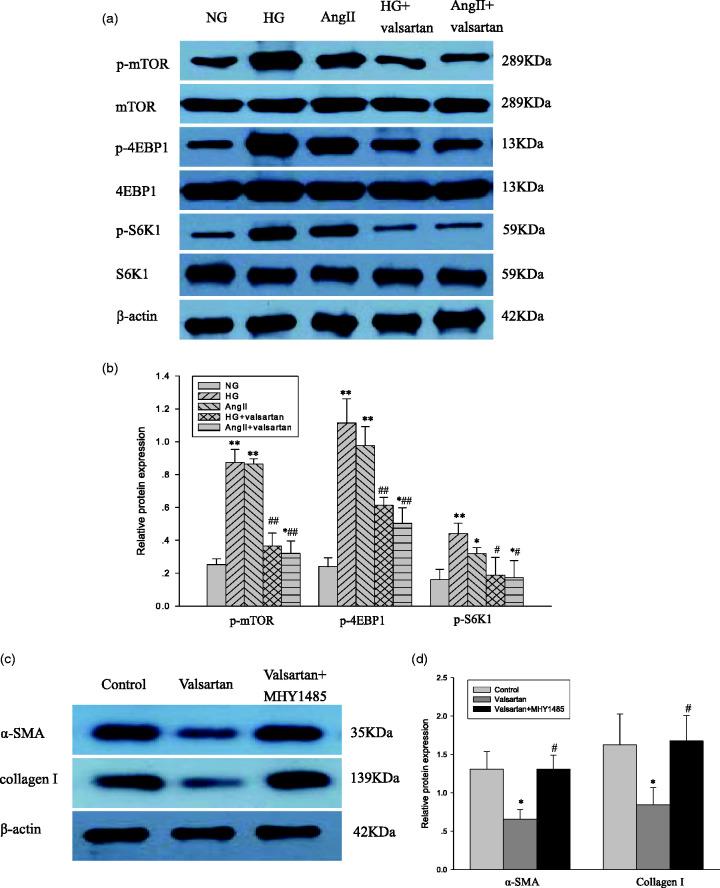
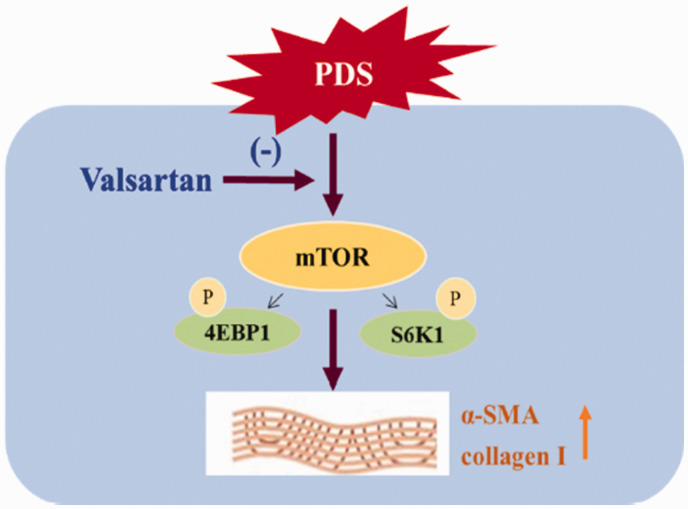
Our study provided new insight into the mechanism underlying the preservation of the peritoneum by valsartan. The results demonstrated that the mice receiving chronic high glucose (HG) peritoneal dialysis solution infusion showed a typical feature of peritoneal fibrosis (PF), as well as higher expression of α-smooth muscle actin (α-SMA) and collagen I. In vitro, HG increased the protein expression of α-SMA and collagen I in a dose-dependent manner, while valsartan significantly ameliorated these pathological changes. Interestingly, there was a parallel decrease in the activity of mammalian target of rapamycin complex 1 (mTORC1) and the protein expression levels of α-SMA and collagen I upon treatment with valsartan in vivo and in vitro. Moreover, the mTOR agonist MHY1485 reversed the downregulation of α-SMA and collagen I in vitro, even in the presence of valsartan. Altogether, our findings reported for the first time that valsartan exerts a protective effect against HG-induced PF by inhibiting the activity of the mTORC1 pathway.

Keywords: Valsartan; extracellular matrix accumulation; high-glucose peritoneal dialysis solution; human peritoneal mesothelial cell; mammalian target of rapamycin complex 1; peritoneal fibrosis.


Figures

Figure 1.
Figure 1.
Effect of valsartan on peritoneal histopathological and functional injury in a mouse model of PD. C57BL/6 mice were treated with PBS (control, I and i), 30 mg/kg/d valsartan plus PBS for eight weeks (control+valsartan, II and ii), 4.25% glucose PDS (PDS) for four weeks (III, iii), six weeks (V, v), or eight weeks (VII, vii), or 30 mg/kg/d valsartan plus 4.25% glucose PDS (PDS+valsartan) for four weeks (IV, iv), six weeks (VI, vi), or eight weeks (VIII, viii). (a) H&E staining and (b) Masson’s trichrome staining of the parietal peritoneum (Scale Bar = 100 µm, original magnification, 100×). (c) Thickness of the peritoneum. (d) The area of PF. (e) Peritoneal permeability, as determined by PET-glucose. (f) Peritoneal permeability, as determined by PET-BUN analysis. The results represent the mean ± SD of six mice from each group. *P < 0.05 vs. control; **P < 0.01 vs. control; #P < 0.05 vs. PDS group at the same time point, respectively; ##P < 0.001 vs. PDS group at the same time point. (A color version of this figure is available in the online journal.)
Figure 2.
Figure 2.
Effect of valsartan on ECM deposition in the peritoneum of a mouse model of PD. C57BL/6 mice were treated with PBS (control, I and i), 30 mg/kg/d valsartan plus PBS for eight weeks (control+valsartan, II and ii), 4.25% glucose PDS (PDS) for four weeks (III, iii), six weeks (V, v), or eight weeks (VII, vii), or 30 mg/kg/d valsartan plus 4.25% glucose PDS (PDS+valsartan) for four weeks (IV, iv), six weeks (VI, vi), or eight weeks (VIII, viii). Immunohistochemical staining for (a) α-SMA and (b) collagen I in the area of the parietal peritoneum. The positive areas were stained brown (scale bar = 200 µm, original magnification, 200×). (c and d) The values of semiquantitative analysis for the positive areas are expressed as the mean ± SD of six mice from each group. *P < 0.05 vs. control; **P < 0.001 vs. control; #P < 0.05 vs. PDS group at the same time point; ##P < 0.01 vs. PDS group at the same time point. (e–g) The protein levels of α-SMA and collagen I in the visceral peritoneum were further determined by Western blot analysis. The histogram shows the mean ± SD of the densitometric scans of the protein bands from six mice following normalization b to β-actin. *P < 0.05 vs. control; **P < 0.001 vs. control; #P < 0.01 vs. PDS group at the same time point; ##P < 0.001 vs. PDS group at the same time point. (A color version of this figure is available in the online journal.)
Figure 3.
Figure 3.
Effect of valsartan on the expression of the mTORC1 pathway in the peritoneum of a mouse model of PD. C57BL/6 mice were treated with PBS (control), 30 mg/kg/d valsartan plus PBS for eight weeks (control+valsartan), or 4.25% glucose PDS (PDS) or 30 mg/kg/d valsartan plus 4.25% glucose PDS (PDS+valsartan) for three time points (four, six, or eight weeks). (a–d) The protein expression levels of p-mTOR, mTOR, p-4EBP1, 4EBP1, p-S6K1, and S6K1 were determined by Western blot analysis. The histogram shows the mean ± SD of the densitometric scans of the protein bands from six mice following normalization to β-actin. *P < 0.05 vs. control; **P < 0.001 vs. control; #P < 0.05 vs. PDS group at the same time point; ##P < 0.001 vs. PDS group at the same time point.
Figure 4.
Figure 4.
Correlation analysis between ECM accumulation and the expression of the mTORC1 pathway in the peritoneum of a PD mouse model. C57BL/6 mice were treated with PBS (control), 30 mg/kg/d valsartan plus PBS for eight weeks (control+valsartan), or 4.25% glucose PDS (PDS) or 30 mg/kg/d valsartan plus 4.25% glucose PDS (PDS+valsartan) for three time points (four, six, or eight weeks). According to Western blot data of α-SMA and collagen I expression, ECM accumulation showed positive correlation with (a) p-mTOR, (b) p-4EBP1, and (c) p-S6K1 protein levels. The P-values were two-tailed, and P <0.05 was considered significant.
Figure 5.
Figure 5.
Effect of valsartan on ECM deposition activated by HG in HPMCs. (a and b) HPMCs were stimulated with serum-free medium containing 5.6 mM glucose (NG) or high concentrations of glucose (84, 138, and 236 mM) or 236 mM mannitol (mannitol) for 24 h. The protein levels of α-SMA and collagen I were examined by Western blot analysis. The histogram represents the mean±SD of the densitometric scans of the protein bands from three experiments normalized to β-actin. *P <0.05 vs. NG group; **P <0.001 vs. NG group. (c and d) HPMCs were exposed to serum-free medium containing 5.6 mM glucose (NG) or serum-free medium containing 236 mM glucose (HG), 1 µM valsartan, HG plus 1 µM valsartan, 10 µM valsartan, or HG plus 10 µM valsartan. The protein levels of α-SMA and collagen I were examined by Western blot analysis. The histogram represents the mean ± SD of the densitometric scans for protein bands from three experiments normalized to β-actin. *P <0.05 vs. NG group; **P <0.001 vs. NG group; #P < 0.01 vs. HG group; ##P < 0.001 vs. HG group. (e and f) HPMCs were treated with 5.6 mM glucose (NG) or with 236 mM glucose (HG), or 10−7 M AngII (AngII), or 236 mM glucose plus 10 µM valsartan (HG+valsartan), or 10−7 M AngII plus 10 µM valsartan (AngII+valsartan) for 24 h. The protein levels of α-SMA and collagen I were examined by western blot analysis. The histogram represents the mean ± SD of the densitometric scans for protein bands from three experiments normalized to β-actin. *P <0.001 vs. NG group; #P < 0.01 vs. HG group; ##P < 0.001 vs. HG group; *#P <0.01 vs. AngII group; *##P <0.001 vs. AngII group.
Figure 6.
Figure 6.
Effect of valsartan on the expression of the mTORC1 pathway activated by HG in HPMCs. (a and b) HPMCs were treated with 5.6 mM glucose (NG) or with 236 mM glucose (HG), or 10−7 M AngII (AngII), or 236 mM glucose plus 10 µM valsartan (HG+valsartan), or 10−7 M AngII plus 10 µM valsartan (AngII+valsartan) for 24 h. The protein levels of p-mTOR, mTOR, p-4EBP1, 4EBP1, p-S6K1, and S6K1 were examined by Western blot analysis. The histogram represents the mean ± SD of the densitometric scans of the protein bands from three experiments normalized to β-actin. *P <0.05 vs. NG group; **P <0.01 vs. NG group; #P < 0.01 vs. HG group; ##P < 0.001 vs. HG group; *#P <0.05 vs. AngII group; *##P <0.001 vs. AngII group. (c and d) HPMCs were treated without (control) or with 10 µM valsartan (valsartan) or 10 µM valsartan plus 2 µM MHY1485 (valsartan+MHY1485) for 24 h. The protein levels of α-SMA and collagen I were examined by Western blot analysis. The histogram represents the mean ± SD of the densitometric scans for protein bands from three experiments normalized to β-actin. *P <0.05 vs. control; #P < 0.05 vs. valsartan group.
Figure 7.
Figure 7.
Schematic model of the protective mechanism of valsartan against HG-induced PF in PMCs. Valsartan significantly inhibits HG-induced ECM accumulation in the peritoneum, which manifests as decreased expression levels of α-SMA and collagen I. These effects are correlated with a decrease in the expression of the mTORC1 pathway, which is mediated by the downregulation of p-mTOR, p-4EBP1, and p-S6K1 levels. Overall, valsartan exerts an obvious protective effect against HG-induced PF, which is partly due to the inhibition of the mTORC1 pathway in PMCs. (A color version of this figure is available in the online journal.)

Similar articles

Cited by

References

    1. Zhang Z, Jiang N, Ni Z. Strategies for preventing peritoneal fibrosis in peritoneal dialysis patients: new insights based on peritoneal inflammation and angiogenesis. Front Med 2017; 11:349–58 - PubMed
    1. Zhou Q, Bajo MA, Del Peso G, Yu X, Selgas R. Preventing peritoneal membrane fibrosis in peritoneal dialysis patients. Kidney Int 2016; 90:515–24 - PubMed
    1. Lu Q, Chen YB, Yang H, Wang WW, Li CC, Wang L, Wang J, Du L, Yin XX. Inactivation of TSC1 promotes epithelial-mesenchymal transition of renal tubular epithelial cells in mouse diabetic nephropathy. Acta Pharmacol Sin 2019; 40:1555–67 - PMC - PubMed
    1. Sun X, Wei W, Ren J, Liang Y, Wang M, Gui Y, Xue X, Li J, Dai C. Inhibition of 4E-BP1 phosphorylation promotes tubular cell escaping from G2/M arrest and ameliorates kidney fibrosis. Cell Signal 2019; 62:109331. - PubMed
    1. Woodcock HV, Eley JD, Guillotin D, Plate M, Nanthakumar CB, Martufi M, Peace S, Joberty G, Poeckel D, Good RB, Taylor AR, Zinn N, Redding M, Forty EJ, Hynds RE, Swanton C, Karsdal M, Maher TM, Bergamini G, Marshall RP, Blanchard AD, Mercer PF, Chambers RC. The mTORC1/4E-BP1 axis represents a critical signaling node during fibrogenesis. Nat Commun 2019; 10:6. - PMC - PubMed

Publication types

MeSH terms