. 2020 May 14;13(1):69.
doi: 10.1186/s12920-020-0729-7.

ERα-related chromothripsis enhances concordant gene transcription on chromosome 17q11.1-q24.1 in luminal breast cancer

Affiliations

ERα-related chromothripsis enhances concordant gene transcription on chromosome 17q11.1-q24.1 in luminal breast cancer

Chun-Lin Lin et al. BMC Med Genomics. .

Abstract

Background: Chromothripsis is an event of genomic instability leading to complex chromosomal alterations in cancer. Frequent long-range chromatin interactions between transcription factors (TFs) and targets may promote extensive translocations and copy-number alterations in proximal contact regions through inappropriate DNA stitching. Although studies have proposed models to explain the initiation of chromothripsis, few discussed how TFs influence this process for tumor progression.

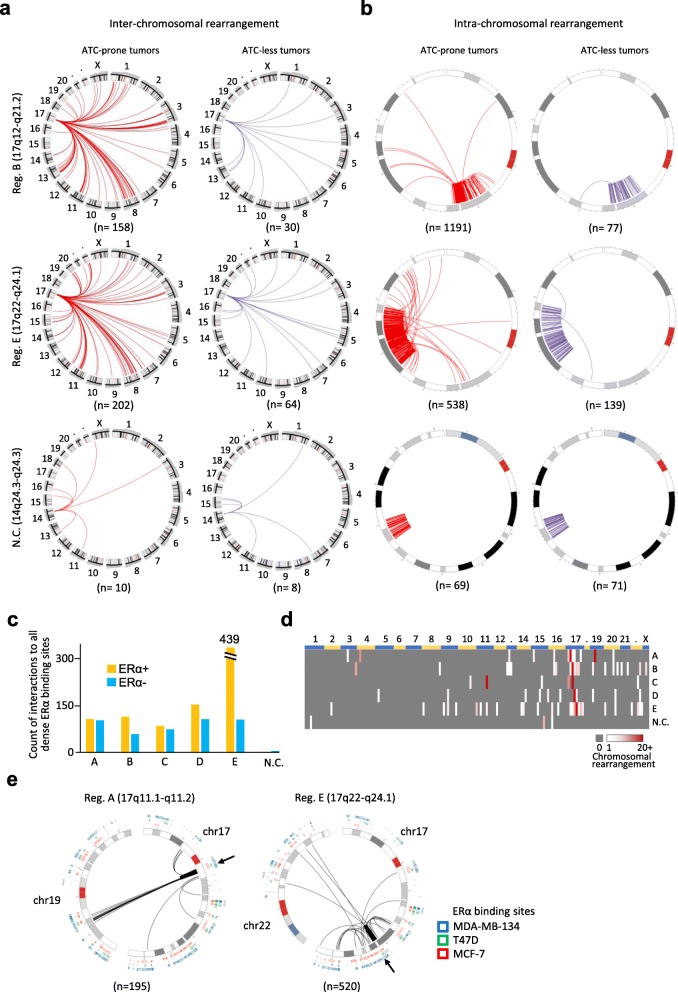
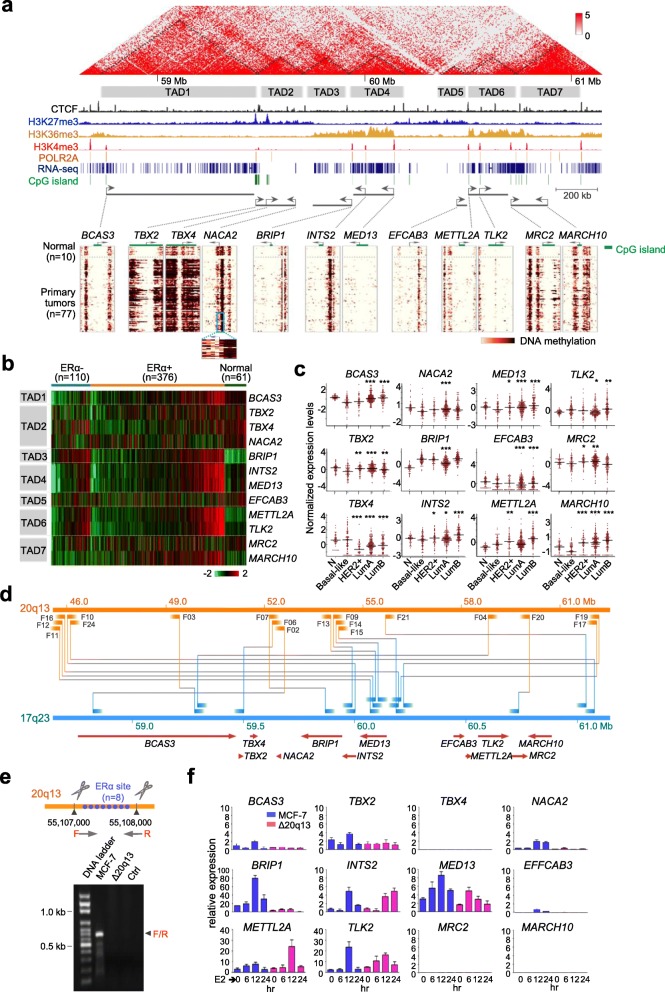
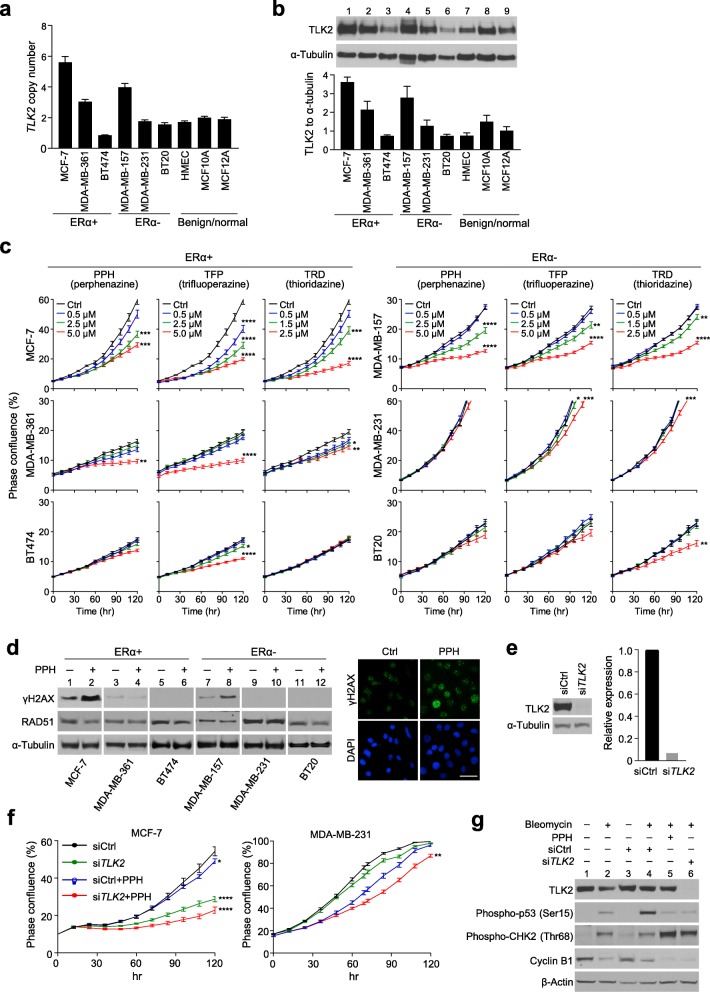
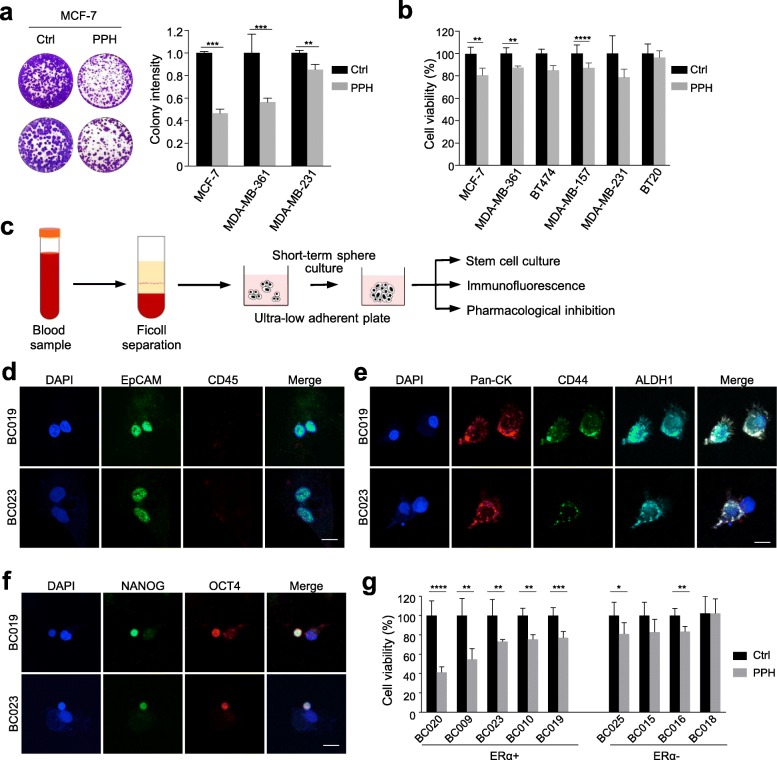
Methods: This study focused on genomic alterations in amplification associated regions within chromosome 17. Inter-/intra-chromosomal rearrangements were analyzed using whole genome sequencing data of breast tumors in the Cancer Genome Atlas (TCGA) cohort. Common ERα binding sites were defined based on MCF-7, T47D, and MDA-MB-134 breast cancer cell lines using univariate K-means clustering methods. Nanopore sequencing technology was applied to validate frequent rearrangements detected between ATC loci on 17q23 and an ERα hub on 20q13. The efficacy of pharmacological inhibition of a potentially druggable target gene on 17q23 was evaluated using breast cancer cell lines and patient-derived circulating breast tumor cells.

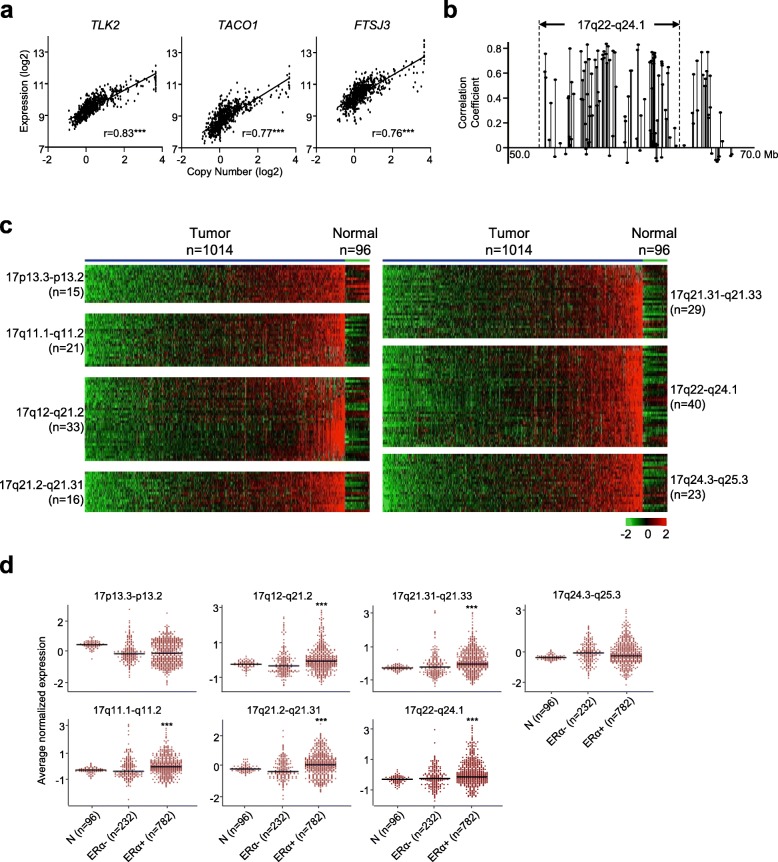
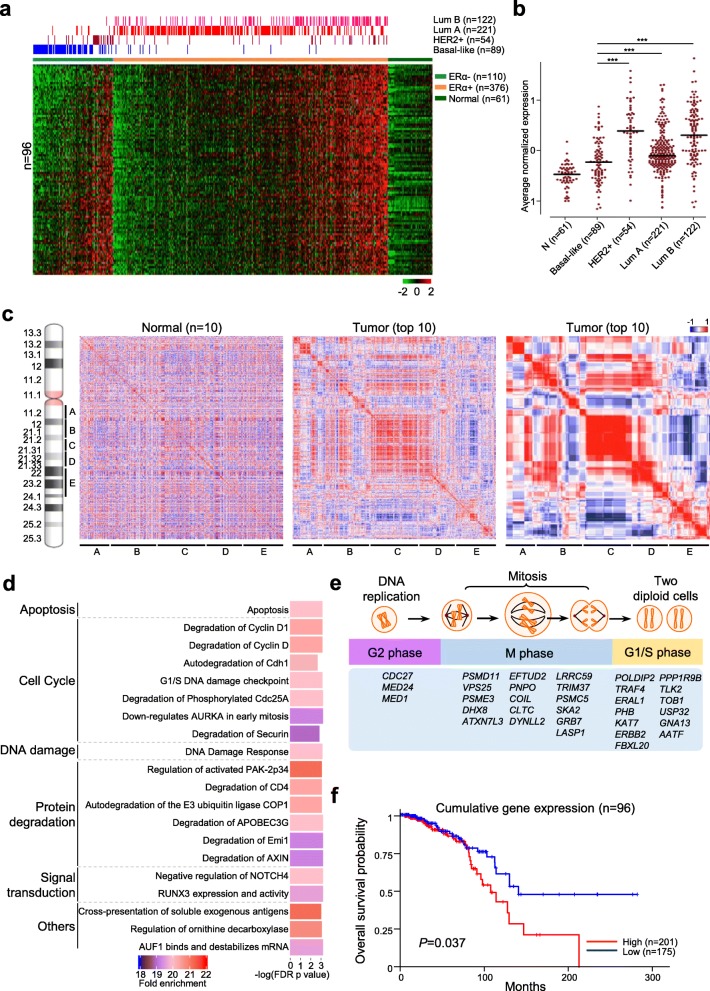
Results: There are five adjoining regions from 17q11.1 to 17q24.1 being hotspots of chromothripsis. Inter-/intra-chromosomal rearrangements of these regions occurred more frequently in ERα-positive tumors than in ERα-negative tumors. In addition, the locations of the rearrangements were often mapped within or close to dense ERα binding sites localized on these five 17q regions or other chromosomes. This chromothriptic event was linked to concordant upregulation of 96 loci that predominantly regulate cell-cycle machineries in advanced luminal tumors. Genome-editing analysis confirmed that an ERα hub localized on 20q13 coordinately regulates a subset of these loci localized on 17q23 through long-range chromosome interactions. One of these loci, Tousled Like Kinase 2 (TLK2) known to participate in DNA damage checkpoint control, is an actionable target using phenothiazine antipsychotics (PTZs). The antiproliferative effect of PTZs was prominent in high TLK2-expressing cells, compared to low expressing cells.

Conclusion: This study demonstrates a new approach for identifying tumorigenic drivers from genomic regions highly susceptible to ERα-related chromothripsis. We found a group of luminal breast tumors displaying 17q-related chromothripsis for which antipsychotics can be repurposed as treatment adjuncts.

Keywords: Chromosomal rearrangement; Chromothripsis; Concordant transcription; Druggable target; ERα; Luminal subtype breast cancer; Nanopore sequencing.


Conflict of interest statement

The authors declare that they have no competing interests.

Figures

Fig. 1
Fig. 1
Genomic survey with two-step geomapping approach identifies amplification-associated transcription coupling (ATC) loci clustered in seven genomic regions. a. Example genes with high correlation coefficients between copy-number and expression levels. b. Example region aggregated with genes of expression and copy-number correlation coefficients ≥0.6 (referred as ATC loci) identified by the optimal univariate k-means clustering method. c. Expression profiles of ATC loci in the seven identified genomic regions by tumor (n = 1014) and normal controls (n = 96). d. Average normalized expression of ATC loci in the seven genomic regions by the status of estrogen receptor α (ERα). Pearson correlation coefficients (r) and P-values are shown (*P < 0.05, **P < 0.01, ***P < 0.001)
Fig. 2
Fig. 2
Amplification-associated transcription coupling (ATC) loci on 17q are functionally linked to cell-cycle control. a. The expression profile of breast tumors with PAM50 subtypes and normal controls of the 96 ATC loci from the five regions on 17q (17q11.1-q11.2; 17q12-q21.2; 17q21.2-q21.31; 17q21.31-q21.33; 17q22-q24.1). Samples of PAM50 subtype status are shown in different colors on the top of the heat map. Details of gene names were provided in Additional file 1: Figure S1. b. Average normalized expression of the 96 ATC loci in different PAM50 subtypes and normal controls. P-values are shown (***P < 0.001). c. Locations of the five regions indicated on the ideogram of chromosome 17. Correlation profiles of all genes in the five 17q regions calculated based on their expression levels (left and middle) and copy numbers (right). The genes were listed symmetrically in each profile (from left to right and from top to bottom) according to the order of their genomic locations. Normal controls were randomly selected from the 61 adjacent normal samples in Fig. 2A, and tumor groups were 10 samples with the highest overall expression of the 96 ATC loci. The locations of the five genomic regions were indicated beneath the correlation profiles. d. Pathway enrichment analysis of the 96 ATC loci using the GO enrichment analysis tools. e. Thirty-two genes among the 96 ATC loci are related to cell-cycle functions based on literature review. f. Kaplan-Meier overall survival curves of ERα-positive samples grouped by high/low cumulative normalized expressions of the 96 ATC loci. P-values were calculated using log-rank tests
Fig. 3
Fig. 3
ERα-related chromosomal rearrangements of the five 17q regions. a, b. Comparison of frequencies of chromosomal rearrangements between ATC-prone tumors (n = 15) and ATC-less tumors (n = 15). Circos plots of inter- (a) and intra- (b) chromosomal rearrangements related to two 17q regions and one negative control region on 14q. The plots of the rest 17q regions were displayed in Additional file 1: Figure S2. c. Frequencies of inter−/intra-chromosomal rearrangements in the five 17q regions by the hormone receptor status. d. Frequencies of inter−/intra-chromosomal rearrangements of each 17q regions against the 170 dense ERα binding sites of the whole genome. The dense ERα binding sites were ordered based on their genomic locations in each chromosome on the X-axis of the heat map (also see Additional file 2: Table S1). e. Examples of inter−/intra-chromosomal rearrangements against specific dense ERα binding site from two 17q regions (Region A and Region E pointed by black arrows). Locations of ERα binding sites from MCF-7, T47D, and MDA-MB-134 were displayed outside around the Circos plots
Fig. 4
Fig. 4
The transcription of 17q23 amplification-associated transcription coupling (ATC) loci is concordantly regulated through long-range interactions with an ERα hub on 20q13. a. 17q23 region with Hi-C interaction frequencies overlaid on ChIP-seq peaks and RNA-seq (top) from human mammary epithelial cells (HMECs), and DNA methylation landscapes (bottom) of primary breast tumors and normal controls. The dotted triangles indicate identified topologically associating domains (TADs). A total of seven TADs (four active/open and three repressive/closed) at the 17q23 region flanked by enrichment of boundary-associated CTCF peaks. b. Expression profile of the 12 genes in this region of tumors and normal controls. c. Normalized expression of the 12 genes on 17q23 by PAM50 subtypes. d. Inter-chromosomal rearrangement between 17q23 and 20q13. Breakpoint junctions used for Nanopore sequencing (see also Additional file 1: Figure S3). e. Abrogation of estrogen-mediated transcriptional activation of 17q23 genes by CRISPR/Cas9 targeted deletion of an ERα hub at 20q13. Blue dots indicate previously identified ERα sites located within a 1-kb region on 20q13. Arrowheads denote the targeting sites by the single guide RNAs (sgRNAs) and PCR primers used for validation of the deletion are shown by horizontal arrows. f. Quantitative RT-PCR carried out upon estrogen (E2) stimulation over a time course. Data shown are mean ± SD of three independent experiments
Fig. 5
Fig. 5
The amplification-associated transcription coupling (ATC) locus TLK2 is an actionable target for 17q23-amplified breast cancers. a. DNA copy-numbers of TLK2 across normal, benign and breast cancer cell lines. Quantitative PCR assays were used to determine copy number alterations. Data represent mean ± standard error of the mean (SEM) of three independent experiments. b. Western blot detecting TLK2 protein expressed in normal, benign and breast cancer cell lines. Loading amount was normalized with α-tubulin. Data represent mean ± standard error of the mean (SEM) of three independent experiments. c. Antiproliferative effects of antipsychotics on breast cancer cell lines. Cells were treated with or without phenothiazine derivatives (PPH, TFP and TRD) at various concentrations. Phase confluence percentage of the cells was collected every 12 h totally for a period of 5 days using IncuCyte ZOOM live-cell imaging system. Quadruplicate replicates were used in each experiment. Quantitative analysis of cell growth 120 h after drug treatment by one-way ANOVA (vs Ctrl). d. DNA damage response in cells treated with or without PPH (5.0 μM) was analyzed with Western blot and immunostaining. Double strand breaks were induced by bleomycin. γH2AX was accumulated more in MCF-7 and MDA-MB-157 cells treated with PPH. No significant difference of RAD51 expression was noted between the cells treated with or without PPH. Representative immunofluorescence images of γH2AX foci (green) were shown in MCF-7 cells treated with or without PPH (right). Scale bar, 30 μm. e. Western blot analysis of TLK2 siRNA knockdown efficiency in MCF-7 cells. TLK2 protein level was markedly decreased in the cells treated with TLK2 siRNA. f. Inhibitory effect of TLK2 knockdown and PPH treatment (5.0 μM) on cell proliferation of MCF-7 and MDA-MB-231 cells. Phase confluence percentage of the cells was collected every 12 h totally for a period of 5 days using IncuCyte ZOOM live-cell imaging system. Quantitative analysis of cell growth 120 h after drug treatment by one-way ANOVA (vs siCtrl). g. Western blot analysis of the indicated signaling molecules in MCF-7 cells treated with bleomycin, TLK2 siRNA knockdown and/or PPH
Fig. 6
Fig. 6
Ex vivo pharmacological treatment reduces survival of breast cancer cells. a. Clonogenic assays show long-term effect of PPH treatment on MCF-7, MDA-MB-361, and MDA-MB-231 cells. Colony intensity was shown as mean ± SD of three replicates. b. Cell viability assay on breast cancer cell lines after treatment with PPH for 72 h. Data are represented as mean ± SEM of five replicates. c. Workflow of isolation, enrichment and downstream analysis of circulating tumor cells (CTCs) from breast cancer patients’ blood samples. d-f. Immunostaining of enriched CTCs derived from patient blood samples. Scale bars, 10 μm. g. Cell viability assay of patient CTCs with PPH treatment. Enriched CTCs were treated with 5 μM of PPH or vehicle control for 72 h. Data are represented as mean ± SEM of five replicates. (*P < 0.05, **P < 0.01, ***P < 0.001, and ****P < 0.0001, Student’s t-test)

References

    1. Lee EYHP, Muller WJ. Oncogenes and tumor suppressor genes. Cold Spring Harb Perspect Biol. 2010;2(10):a003236. doi: 10.1101/cshperspect.a003236. - DOI - PMC - PubMed
    1. Sircoulomb F, Bekhouche I, Finetti P, Adélaïde J, Hamida AB, Bonansea J, et al. Genome profiling of ERBB2-amplified breast cancers. BMC Cancer. 2010;10(1):539. doi: 10.1186/1471-2407-10-539. - DOI - PMC - PubMed
    1. Cui YM, Jiao HL, Ye YP, Chen CM, Wang JX, Tang N, et al. FOXC2 promotes colorectal cancer metastasis by directly targeting MET. Oncogene. 2014;34:4379. doi: 10.1038/onc.2014.368. - DOI - PubMed
    1. Purmann A, Toedling J, Schueler M, Carninci P, Lehrach H, Hayashizaki Y, et al. Genomic organization of transcriptomes in mammals: Coregulation and cofunctionality. Genomics. 2007;89(5):580–587. doi: 10.1016/j.ygeno.2007.01.010. - DOI - PubMed
    1. Laganière J, Deblois G, Lefebvre C, Bataille AR, Robert F, Giguère V. Location analysis of estrogen receptor α target promoters reveals that FOXA1 defines a domain of the estrogen response. Proc Natl Acad Sci U S A. 2005;102(33):11651. doi: 10.1073/pnas.0505575102. - DOI - PMC - PubMed

Publication types

MeSH terms