

Prediction of Outcome Using Quantified Blood Volume in Aneurysmal SAH
- PMID: 32409315
- PMCID: PMC7342737
- DOI: 10.3174/ajnr.A6575
Prediction of Outcome Using Quantified Blood Volume in Aneurysmal SAH
Abstract
Background and purpose: In patients with SAH, the amount of blood is strongly associated with clinical outcome. However, it is commonly estimated with a coarse grading scale, potentially limiting its predictive value. Therefore, we aimed to develop and externally validate prediction models for clinical outcome, including quantified blood volumes, as candidate predictors.
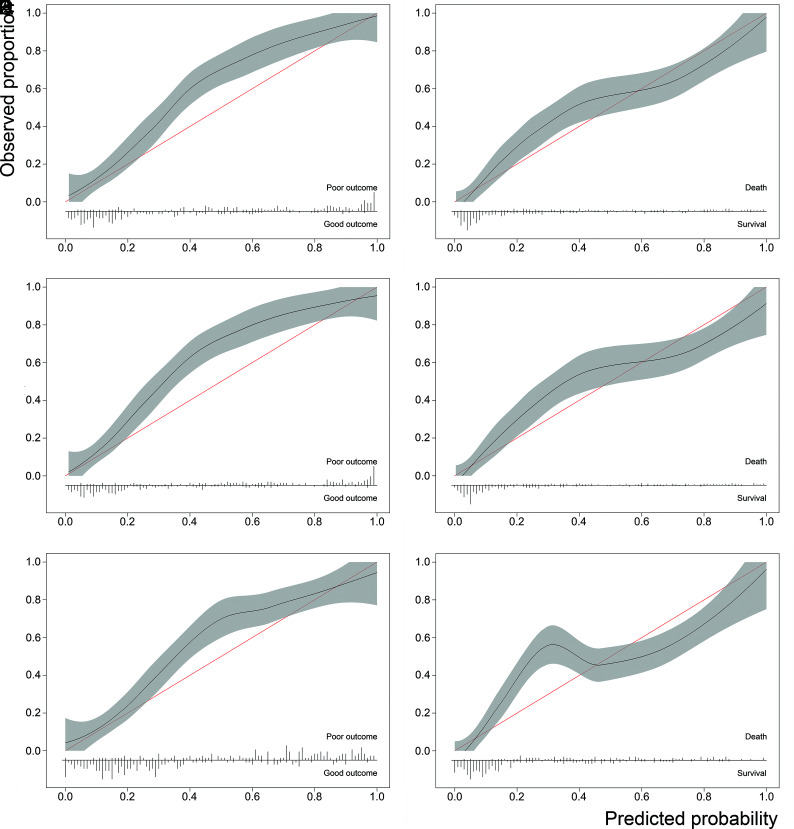
Materials and methods: Clinical and radiologic candidate predictors were included in a logistic regression model. Unfavorable outcome was defined as a modified Rankin Scale score of 4-6. An automatic hemorrhage-quantification algorithm calculated the total blood volume. Blood was manually classified as cisternal, intraventricular, or intraparenchymal. The model was selected with bootstrapped backward selection and validated with the R 2, C-statistic, and calibration plots. If total blood volume remained in the final model, its performance was compared with models including location-specific blood volumes or the modified Fisher scale.
Results: The total blood volume, neurologic condition, age, aneurysm size, and history of cardiovascular disease remained in the final models after selection. The externally validated predictive accuracy and discriminative power were high (R 2 = 56% ± 1.8%; mean C-statistic = 0.89 ± 0.01). The location-specific volume models showed a similar performance (R 2 = 56% ± 1%, P = .8; mean C-statistic = 0.89 ± 0.00, P = .4). The modified Fisher models were significantly less accurate (R 2 = 45% ± 3%, P < .001; mean C-statistic = 0.85 ± 0.01, P = .03).
Conclusions: The total blood volume-based prediction model for clinical outcome in patients with SAH showed a high predictive accuracy, higher than a prediction model including the commonly used modified Fisher scale.
© 2020 by American Journal of Neuroradiology.
Figures
References
Publication types
MeSH terms
LinkOut - more resources
Full Text Sources