

Distinguishing the Neural Correlates of Perceptual Awareness and Postperceptual Processing
- PMID: 32409620
- PMCID: PMC7326348
- DOI: 10.1523/JNEUROSCI.0120-20.2020
Distinguishing the Neural Correlates of Perceptual Awareness and Postperceptual Processing
Abstract
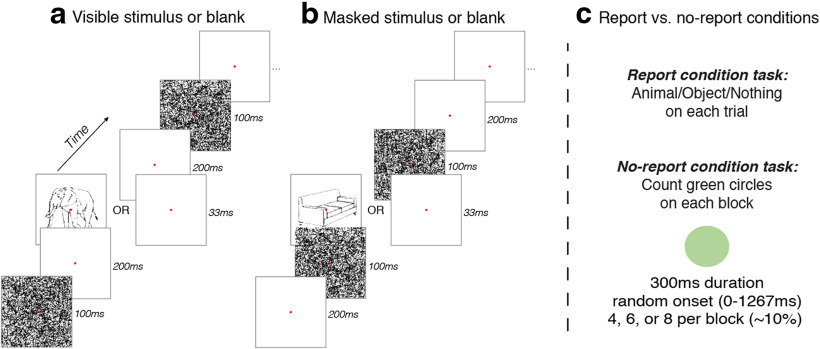
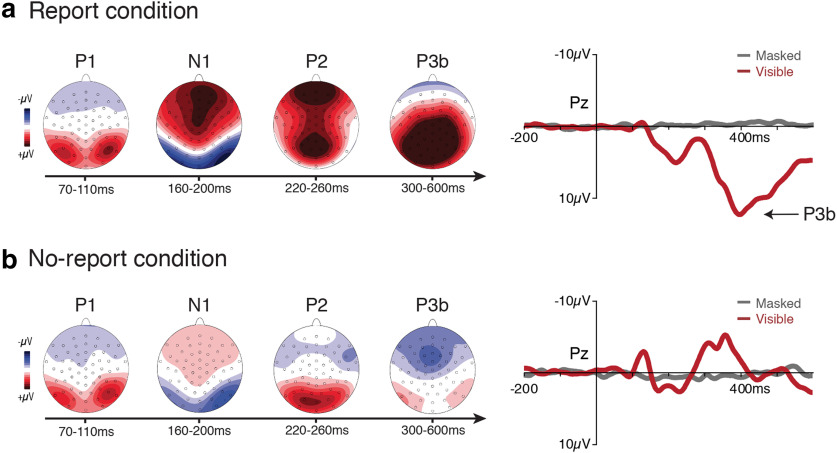
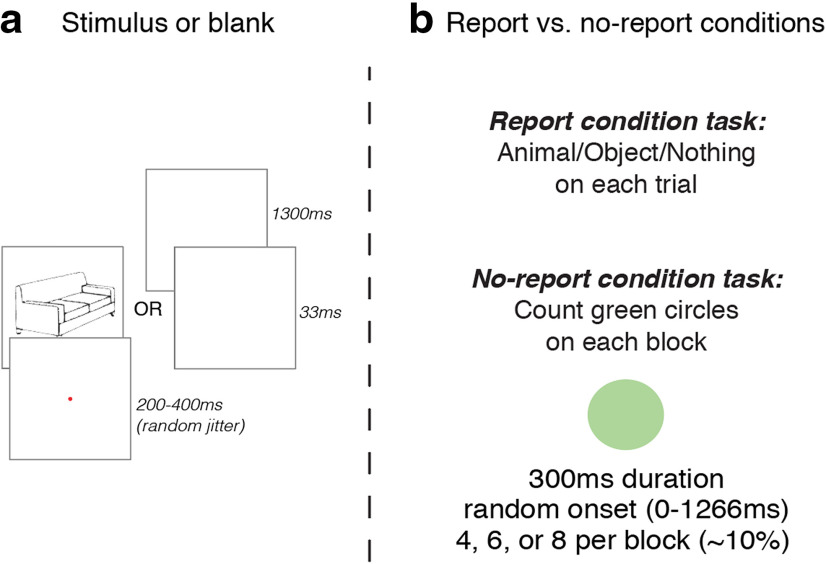
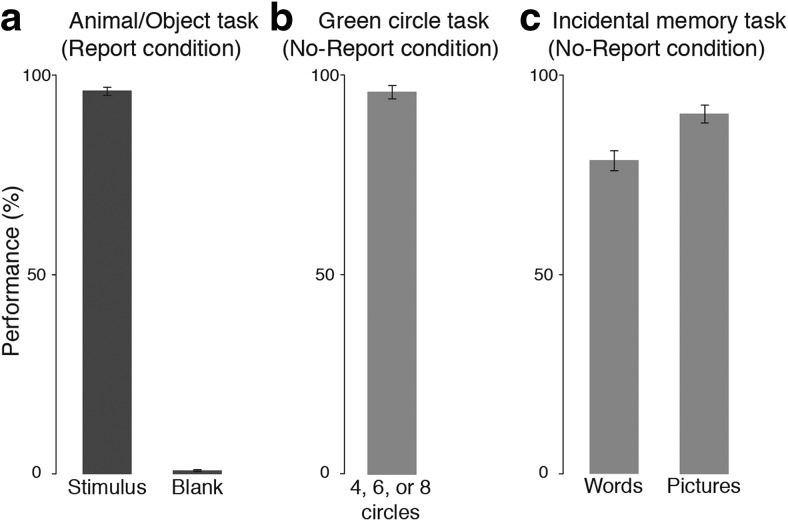
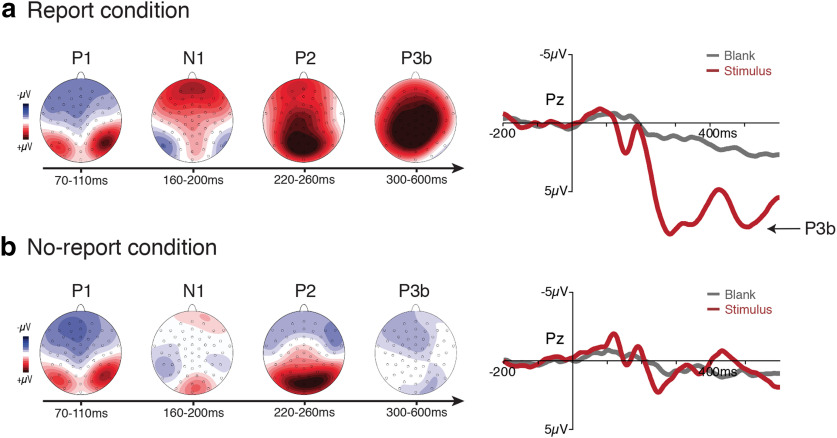
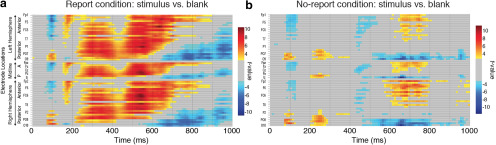
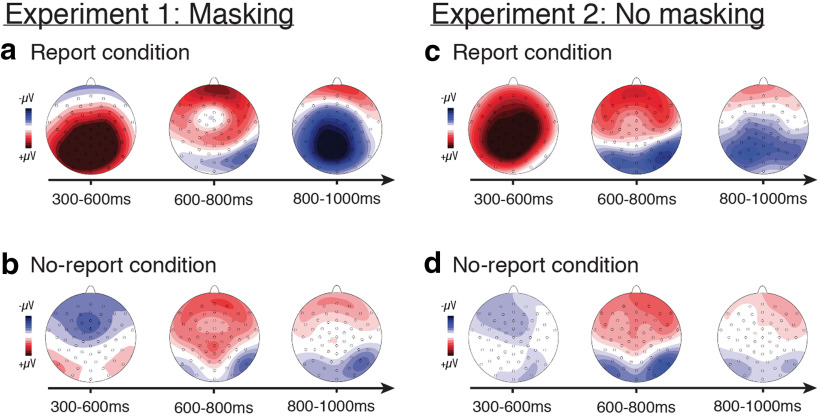
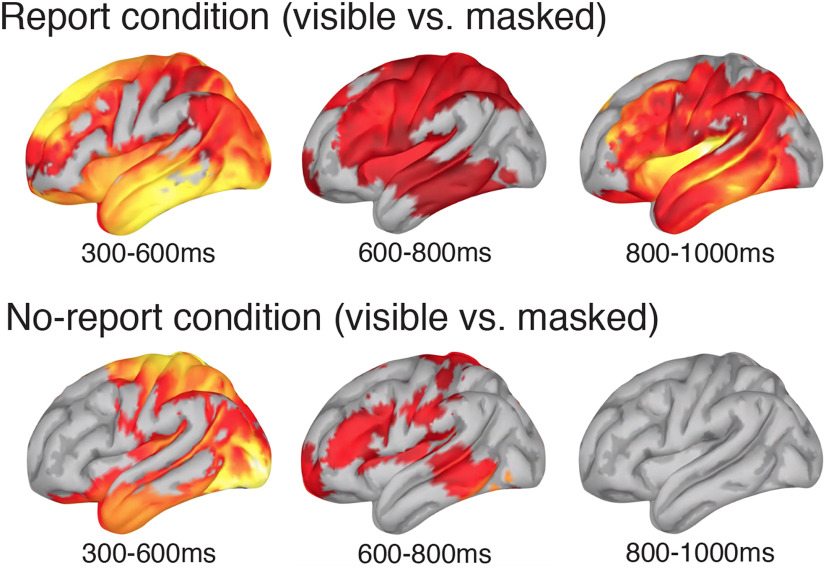
To identify the neural correlates of perceptual awareness, researchers often compare the differences in neural activation between conditions in which an observer is or is not aware of a stimulus. While intuitive, this approach often contains a critical limitation: to link brain activity with perceptual awareness, observers traditionally report the contents of their perceptual experience. However, relying on observers' reports is problematic because it is difficult to know whether the neural responses being measured are associated with conscious perception or with postperceptual processes involved in the reporting task (e.g., working memory, decision-making). To address this issue, we combined a standard visual masking paradigm with a recently developed "no-report" paradigm in male/female human participants. In the visual masking paradigm, observers saw images of animals and objects that were visible or invisible, depending on their proximity to masks. Meanwhile, on half of the trials, observers reported the contents of their perceptual experience (i.e., report condition), while on the other half of trials they refrained from reporting about their experiences (i.e., no-report condition). We used electroencephalography to examine how visibility interacts with reporting by measuring the P3b event-related potential, one of the proposed canonical "signatures" of conscious processing. Overall, we found a robust P3b in the report condition, but no P3b whatsoever in the no-report condition. This finding suggests that the P3b itself is not a neural signature of conscious processing and highlights the importance of carefully distinguishing the neural correlates of perceptual awareness from postperceptual processing.SIGNIFICANCE STATEMENT What are the neural signatures that differentiate conscious and unconscious processing in the brain? Perhaps the most well established candidate signature is the P3b event-related potential, a late slow wave that appears when observers are aware of a stimulus, but disappears when a stimulus fails to reach awareness. Here, however, we found that the P3b does not track what observers are perceiving, but instead tracks what observers are reporting. When observers are aware of simple visual stimuli, the P3b is nowhere to be found unless observers are reporting the contents of their experience. These results challenge the well established notion of the P3b as a neural marker of awareness and highlight the need for new approaches to the neuroscience of consciousness.
Keywords: EEG; attention; awareness; consciousness; perception; vision.
Copyright © 2020 the authors.
Figures
Comment in
-
Don't tell anyone: the importance of no-report paradigms in neuroscience of consciousness.J Neurophysiol. 2021 May 1;125(5):1577-1579. doi: 10.1152/jn.00569.2020. Epub 2021 Mar 31. J Neurophysiol. 2021. PMID: 33788637
Similar articles
-
Dissociating Perceptual Awareness and Postperceptual Processing: The P300 Is Not a Reliable Marker of Somatosensory Target Detection.J Neurosci. 2021 May 26;41(21):4686-4696. doi: 10.1523/JNEUROSCI.2950-20.2021. Epub 2021 Apr 13. J Neurosci. 2021. PMID: 33849946 Free PMC article.
-
Neural signatures of visual awareness independent of postperceptual processing.Cereb Cortex. 2024 Nov 5;34(11):bhae415. doi: 10.1093/cercor/bhae415. Cereb Cortex. 2024. PMID: 39535504 Free PMC article.
-
Dissociating the Neural Correlates of Consciousness and Task Relevance in Face Perception Using Simultaneous EEG-fMRI.J Neurosci. 2021 Sep 15;41(37):7864-7875. doi: 10.1523/JNEUROSCI.2799-20.2021. Epub 2021 Jul 23. J Neurosci. 2021. PMID: 34301829 Free PMC article.
-
Tracking the processes behind conscious perception: a review of event-related potential correlates of visual consciousness.Conscious Cogn. 2011 Sep;20(3):972-83. doi: 10.1016/j.concog.2011.03.019. Epub 2011 Apr 8. Conscious Cogn. 2011. PMID: 21482150 Review.
-
From sensation to perception: Using multivariate classification of visual illusions to identify neural correlates of conscious awareness in space and time.Perception. 2015;44(1):71-8. doi: 10.1068/p7832. Perception. 2015. PMID: 26489217 Review.
Cited by
-
The influence of feature-based attention and response requirements on ERP correlates of auditory awareness.Neurosci Conscious. 2024 Jul 23;2024(1):niae031. doi: 10.1093/nc/niae031. eCollection 2024. Neurosci Conscious. 2024. PMID: 39045031 Free PMC article.
-
Illusory object recognition is either perceptual or cognitive in origin depending on decision confidence.PLoS Biol. 2023 Mar 2;21(3):e3002009. doi: 10.1371/journal.pbio.3002009. eCollection 2023 Mar. PLoS Biol. 2023. PMID: 36862734 Free PMC article.
-
Human visual consciousness involves large scale cortical and subcortical networks independent of task report and eye movement activity.Nat Commun. 2022 Nov 29;13(1):7342. doi: 10.1038/s41467-022-35117-4. Nat Commun. 2022. PMID: 36446792 Free PMC article.
-
Awareness and consciousness in humans and animals - neural and behavioral correlates in an evolutionary perspective.Front Syst Neurosci. 2022 Jul 14;16:941534. doi: 10.3389/fnsys.2022.941534. eCollection 2022. Front Syst Neurosci. 2022. PMID: 35910003 Free PMC article.
-
The Neural Correlates of Access Consciousness and Phenomenal Consciousness Seem to Coincide and Would Correspond to a Memory Center, an Activation Center and Eight Parallel Convergence Centers.Front Psychol. 2021 Sep 29;12:749610. doi: 10.3389/fpsyg.2021.749610. eCollection 2021. Front Psychol. 2021. PMID: 34659068 Free PMC article.
References
-
- Benjamini Y, Yekutieli D (2001) The control of the false discovery rate in multiple testing under dependency. Ann Stat 29:1165–1188. 10.1214/aos/1013699998 - DOI
Publication types
MeSH terms
LinkOut - more resources
Full Text Sources