. 2020 May 14;11(1):2393.
doi: 10.1038/s41467-020-16212-w.

Resistance to targeted therapies as a multifactorial, gradual adaptation to inhibitor specific selective pressures

Affiliations

Resistance to targeted therapies as a multifactorial, gradual adaptation to inhibitor specific selective pressures

Robert Vander Velde et al. Nat Commun. .

Abstract

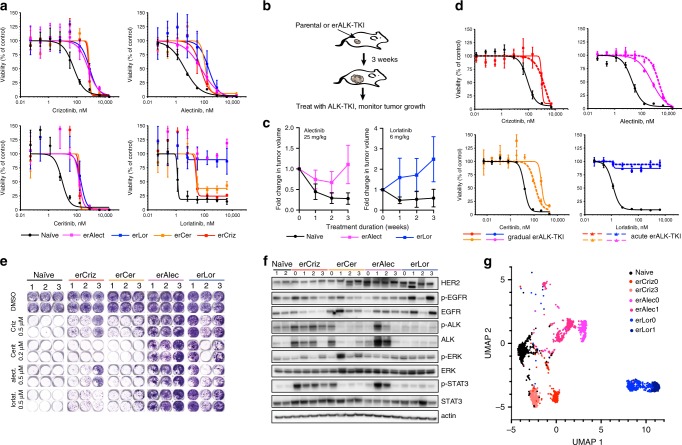
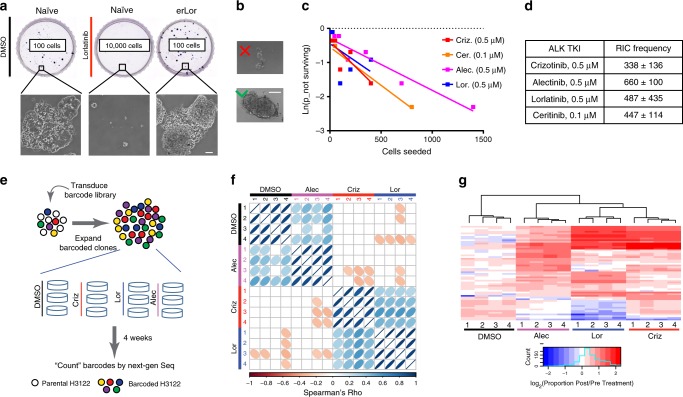
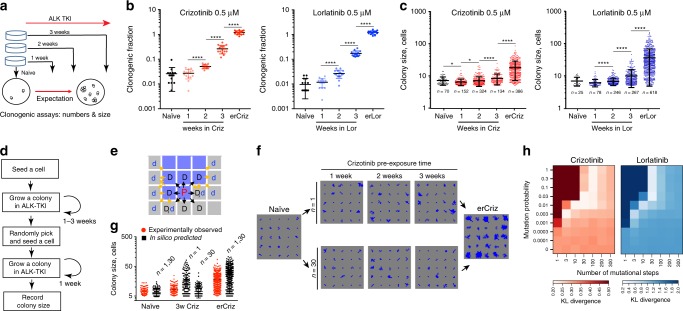
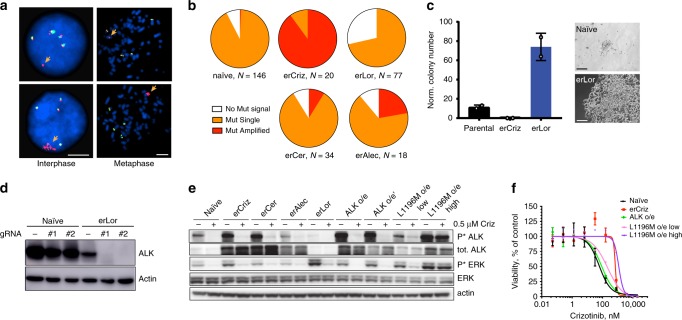
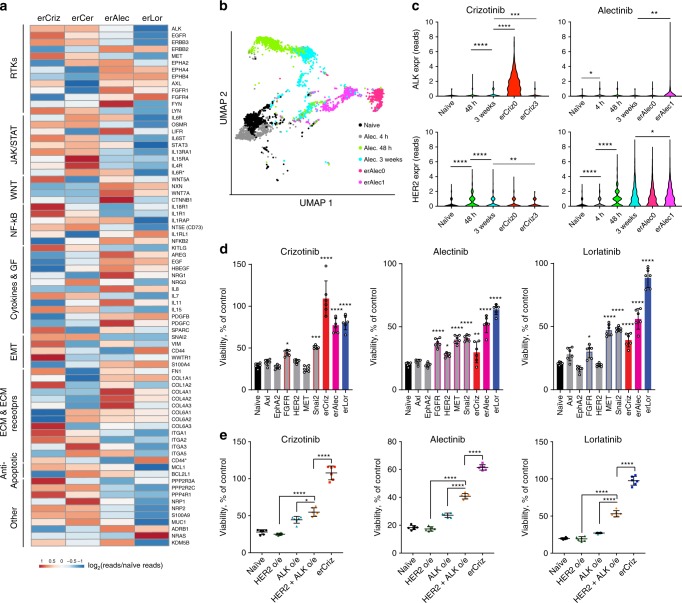
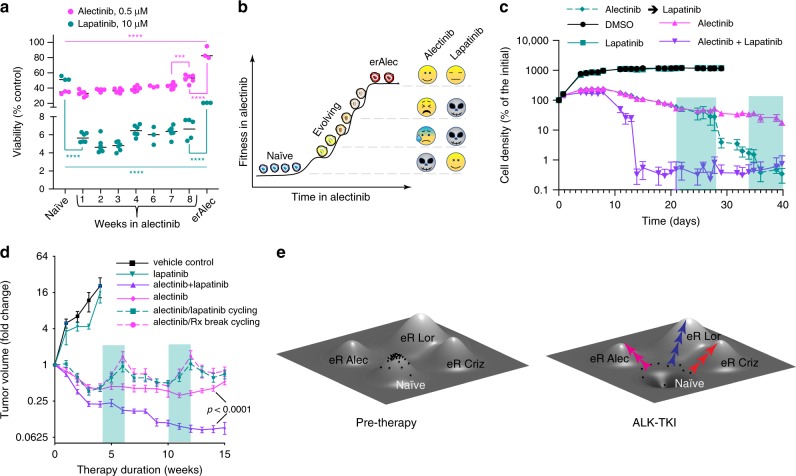
Despite high initial efficacy, targeted therapies eventually fail in advanced cancers, as tumors develop resistance and relapse. In contrast to the substantial body of research on the molecular mechanisms of resistance, understanding of how resistance evolves remains limited. Using an experimental model of ALK positive NSCLC, we explored the evolution of resistance to different clinical ALK inhibitors. We found that resistance can originate from heterogeneous, weakly resistant subpopulations with variable sensitivity to different ALK inhibitors. Instead of the commonly assumed stochastic single hit (epi) mutational transition, or drug-induced reprogramming, we found evidence for a hybrid scenario involving the gradual, multifactorial adaptation to the inhibitors through acquisition of multiple cooperating genetic and epigenetic adaptive changes. Additionally, we found that during this adaptation tumor cells might present unique, temporally restricted collateral sensitivities, absent in therapy naïve or fully resistant cells, suggesting the potential for new therapeutic interventions, directed against evolving resistance.


Conflict of interest statement

The authors declare no competing interests.

Figures

Fig. 1
Fig. 1. Characterization of evolved resistance to ALK-TKIs.
a Sensitivities of the treatment-naive H3122 cell line and its erALK-TKI derivative cell lines to the indicated ALK inhibitors, measured by Cell Titer Glo assay. Y-axis represents luminescent signal normalized to DMSO control. Mean ± SD of experimental triplicates are shown. b Experimental schemata of the xenograft experiment. Treatment is initiated after macroscopic tumors are formed within 3 weeks in the absence of therapies. c Growth dynamics of xenograft tumors initiated by inoculation of erAlect or erLor cells under treatment with indicated doses of ALK-TKIs or vehicle control. Mean ± SD are shown (n = 9 tumors for therapy naive, n = 6 tumors for each of the erALK cells). d Comparison of resistance levels of erALK-TKI cells evolved by gradual and acute drug exposure, measured by Cell Titer Glo assay. Mean ± SD of experimental triplicates are shown. e Sensitivity of independent derivates of erALK-TKI cells to the indicated ALK-TKIs, measured by crystal violet staining after 10 days of growing in the presence of indicated drugs. f Immunoblot analysis of the expression levels of the indicated proteins in the independent derivations of erALK-TKI cells, following 48 h growth in the absence of inhibitors to reduce their direct impact on cell signaling. “0” denotes gradually derived erALK-TKI cell lines, presented in a, “1–3” indicates independent derivate sub-lines obtained by acute selection for resistance in high drug concentrations, same as in e. Raw images shown in Supplementary Fig. 13. g UMAP analysis of single-cell RNA-seq expression of the indicated cell lines.
Fig. 2
Fig. 2. Pre-existence of diverse ALK-TKI tolerant subpopulations.
a Representative images of crystal violet stained whole plates and microscopic images of colonies (at ×10 magnification) following 10 days of culture in DMSO or 0.5 μM lorlatinib. b Illustration of the size cut-off criteria used for quantification of limiting dilution experiments. The scale bars in a and b represent 100 μm. c Fitting of limiting dilution assay data and d quantification of the frequency of resistance-initiating cells. e Schemata of the clone-tracing experiment. f Spearman’s pairwise correlation analysis of positively selected barcodes, which have reached frequency, exceeding the highest barcode frequency in the baseline aliquot sample, between samples indicated in X and Y axes. Numbers indicate biological replicates (separate dishes). g Hierarchical clustering analysis of the positively selected barcodes shown in f. Columns indicate individual biological replicates. Rows indicate individual barcodes.
Fig. 3
Fig. 3. Graduality of evolution of ALK-TKI resistance.
a Experiment schemata. Therapy-naive cells were pre-cultured in the presence of crizotinib or lorlatinib for 0–3 weeks, then seeded at clonogenic densities in the presence of ALK-TKIs or DMSO control. After 7 days, numbers and sizes of colonies are determined. b Clonogenic survival in the presence of the indicated ALK-TKIs after pre-incubation for indicated times; data are normalized to clonogenic survival in DMSO control. Mean ± SD of 15 replicates (separate wells) is shown. c Distributions of colony sizes in the indicated ALK-TKI. *p < 0.05 and **p < 0.0001 of a Mann–Whitney test. Mean ± SD of individual colonies are shown. d Logical flow diagram for the agent-based model, simulating growth during both pre-incubation and the clonogenic assay. e Proliferation space check scheme. Cells are seeded into a 2d lattice that simulates the surface of a culture dish. If space is available (no more than one cell separating the cell from an empty space), a cell can proliferate with a given probability inferred from the experimental data. Blue and gray cells denote occupied and empty spaces respectively. “P” stands for the parent cell, “D” for daughter cell, “d” for displaced cell. Black arrows indicate options for placement of daughter cells, yellow arrows indicate options for displaced cells. Proliferation can occur if a nearby space is either immediately available or separated by a single cell, in which case this cell is pushed into an empty space, with an extra copy of the proliferating cell displacing it. f Example of colony growth simulations, initiated from cells pre-incubated in crizotinib for the indicated time, during the clonogenic growth phase off the assay, contrasting n = 1 vs. n = 30. g Comparing divergence between in silico and experimental data, with n = 1 and n = 30 (epi)mutational steps. Mean ± SD of individual experimental and simulated colonies are shown. h Kullback–Leibler divergence-based comparison of the experimental data with the outcomes of simulations, covering parameter space for the indicated mutation probabilities and numbers of mutational steps.
Fig. 4
Fig. 4. Impact of ALK mutation and amplification on TKI sensitivity.
a Representative images for interphase and metaphase FISH analysis for EML4-ALK fusion and amplification status. Separation of 3′ (red) probe from 5′ (green) probe indicates ALK fusion event (orange arrows). The scale bars represent 5 μm. b Frequency of cells with the indicated EML4-ALK fusion and amplification status in the gradually evolved erALK-TKI cell lines (lines 0 were analyzed). c Impact of CRISPR-mediated genetic ablation of ALK on clonogenic survival of the indicated H3122 derivates. Mean ± SD of experimental duplicates, representing separate dishes with alternative ALK directed guide RNAs; representative colonies are shown. The scale bars represent 100 μm. d Evaluation of EML-ALK ablation by immunoblotting analysis. Raw images shown in Supplementary Fig. 14. e Immunoblot evaluation of the expression and activity of EML4-ALK oncogenic signaling in the presence of Crizotinib or after 48 h of drug holidays, for the indicated cell lines with evolved and engineered resistance. ALK o/e and ALK o/e' denote independently derived sublines.  Raw images shown in Supplementary Fig. 15. f Impact of retrovirally mediated overexpression of EML4-ALK fusion and its L1196M mutant variant on sensitivity to crizotinib, measured by Cell Titer Glo assay. Mean ± SD of experimental triplicates representing separate wells are shown.
Fig. 5
Fig. 5. ALK-TKI resistance integrates multiple mechanisms.
a Normalized mRNA expression for the indicated genes, previously associated with chemotherapy or targeted therapy resistance, in erALK-TKI cell lines across the indicated functional categories. b UMAP analysis of single-cell mRNA expression data from cells exposed to 0.5 μM alectinib for the indicated time duration. c Violin plot of expression levels of ALK and HER2 following indicated duration of exposure to the indicated ALK-TKIs. *p < 0.05, **p < 0.01, ***p < 0.001, and ****p < 0.0001 of a Mann–Whitney U-test. d ALK-TKI sensitivity of engineered cell lines, lentivirally overexpressing indicated genes to the indicated ALK-TKIs (0.5 μM), as determined by Cell Titer Glo assay. Mean ± SD of experimental replicates (n = 6, representing separate wells) are shown. e Impact of combination of individual resistance mechanisms toward sensitivity to indicated ALK-TKIs (0.5 μM), determined by Cell Titer Glo assay. *p < 0.05, **p < 0.01, ***p < 0.001, and ****p < 0.0001 of ANOVA analysis with Dunnett’s (d) or Tukey’s (e) multiple comparison correction. Mean ± SD of experimental replicates (n = 6, representing separate wells) are shown.
Fig. 6
Fig. 6. Collateral sensitivities of evolutionary intermediates.
a Impact of pre-exposure to 0.5 µM alectinib for the indicated periods on sensitivity to alectinib and lapatinib, measured by Cell Titer Glo assay. One-way ANOVA was used for both drugs (p < 0.0001). Adjacent time points were compared using Sidak’s multiple comparison tests (***p < 0.001 and ****p < 0.0001). Mean ± SD of experimental replicates are shown. n = 3, representing separate wells, for naive control and erAlec H3122 cells. n = 6 wells (3 wells each of 2 biological replicates) for cells pre-exposed to alectinib. Data for one of the biological replicates is missing in week 6. b Illustration of association of evolving resistance to alectinib with collateral sensitivity to lapatinib. c Lapatinib can prevent the development of resistance to alectinib in vitro, both as a combination treatment, or in drug cycling. Green shading indicates switching from alectinib to lapatinib monotherapy. Residual signal in the combination therapy and cycling groups reflects autofluorescence, as visual examination revealed lack of surviving tumor cells. Mean ± SD of experimental replicates (n = 3 representing separate wells for DMSO and lapatinib monotherapy, n = 6 for the remaining groups) are shown. d Change in volume of H3122 xenograft tumors treated with indicated therapies; treatment was initiated 3 weeks post tumor implantation. Green shading indicates switching from alectinib to lapatinib monotherapy or vehicle control. Mean values ± SE are shown; n = 6 for lapatinib monotherapy, n = 10 for alectinib monotherapy, switching between alectinib and lapatinib, and alectinib/lapatinib combination, n = 9 for vehicle control, replicates represent separate tumors. e Evolving resistance interpreted through a fitness landscape metaphor. Naive cells occupy a local fitness peak. Drug exposure reshapes the landscape, turning this fitness peak into a fitness trough. Different ALK inhibitors act on partially distinct outliers, directing their evolution toward distinct fitness peaks.

References

    1. Sasaki T, Rodig SJ, Chirieac LR, Janne PA. The biology and treatment of EML4-ALK non-small cell lung cancer. Eur. J. Cancer. 2010;46:1773–1780. doi: 10.1016/j.ejca.2010.04.002. - DOI - PMC - PubMed
    1. Burrell RA, Swanton C. Tumour heterogeneity and the evolution of polyclonal drug resistance. Mol. Oncol. 2014;8:1095–1111. doi: 10.1016/j.molonc.2014.06.005. - DOI - PMC - PubMed
    1. Merlo LM, Pepper JW, Reid BJ, Maley CC. Cancer as an evolutionary and ecological process. Nat. Rev. Cancer. 2006;6:924–935. doi: 10.1038/nrc2013. - DOI - PubMed
    1. Bozic I, Nowak MA. Timing and heterogeneity of mutations associated with drug resistance in metastatic cancers. Proc. Natl Acad. Sci. USA. 2014;111:15964–15968. doi: 10.1073/pnas.1412075111. - DOI - PMC - PubMed
    1. Wodarz D, Komarova NL. Emergence and prevention of resistance against small molecule inhibitors. Semin. Cancer Biol. 2005;15:506–514. doi: 10.1016/j.semcancer.2005.07.002. - DOI - PubMed

Publication types

MeSH terms