. 2020 May 14;18(1):201.
doi: 10.1186/s12967-020-02366-0.

Development and validation of a hypoxia-immune-based microenvironment gene signature for risk stratification in gastric cancer

Affiliations

Development and validation of a hypoxia-immune-based microenvironment gene signature for risk stratification in gastric cancer

Yifan Liu et al. J Transl Med. .

Abstract

Background: Increasing evidences have found that the clinical importance of the interaction between hypoxia and immune status in gastric cancer microenvironment. However, reliable prognostic signatures based on combination of hypoxia and immune status have not been well-established. This study aimed to develop a hypoxia-immune-based gene signature for risk stratification in gastric cancer.

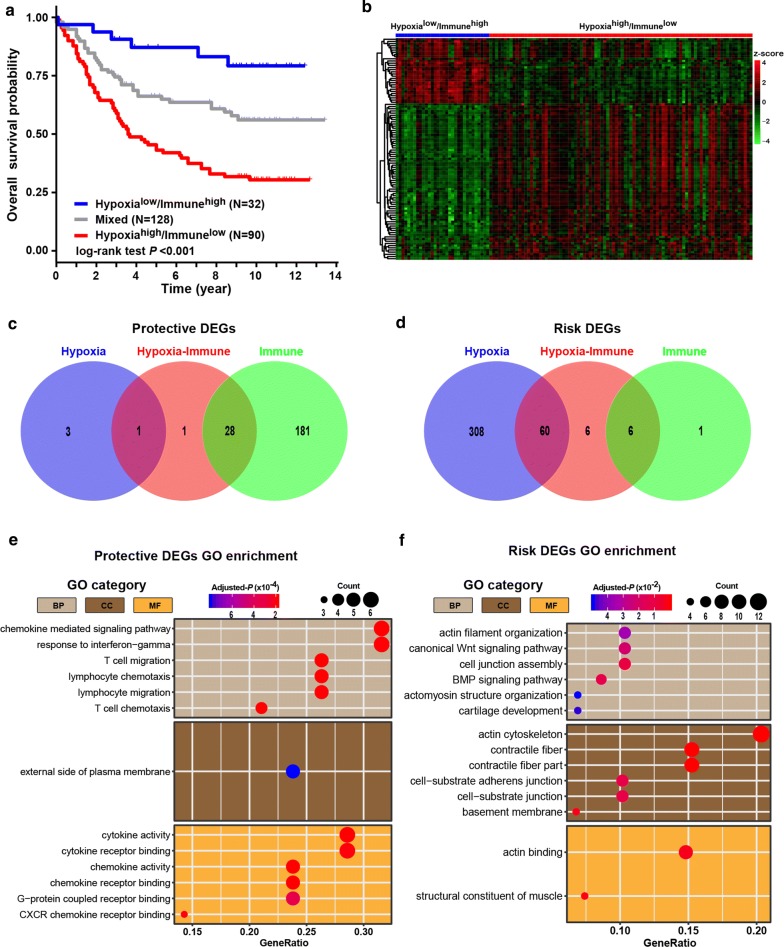
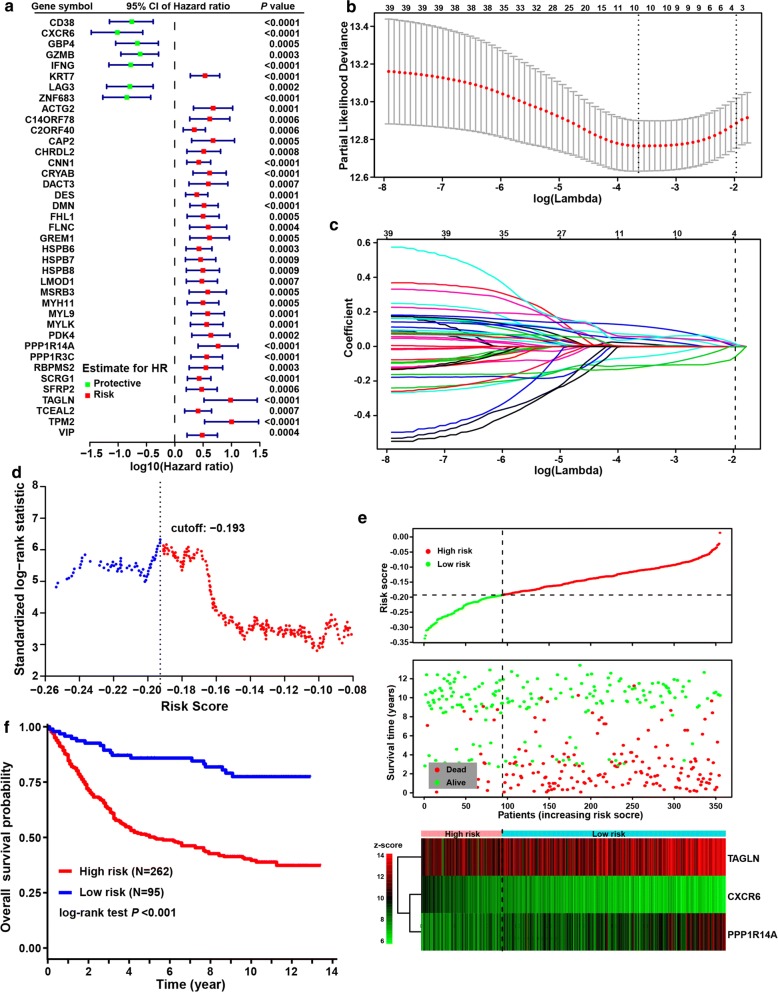
Methods: Hypoxia and immune status was estimated with transcriptomic profiles for a discovery cohort from GEO database using the t-SNE and ESTIMATE algorithms, respectively. The Cox regression model with the LASSO method was applied to identify prognostic genes and to develop a hypoxia-immune-based gene signature. The TCGA cohort and two independent cohorts from GEO database were used for external validation.

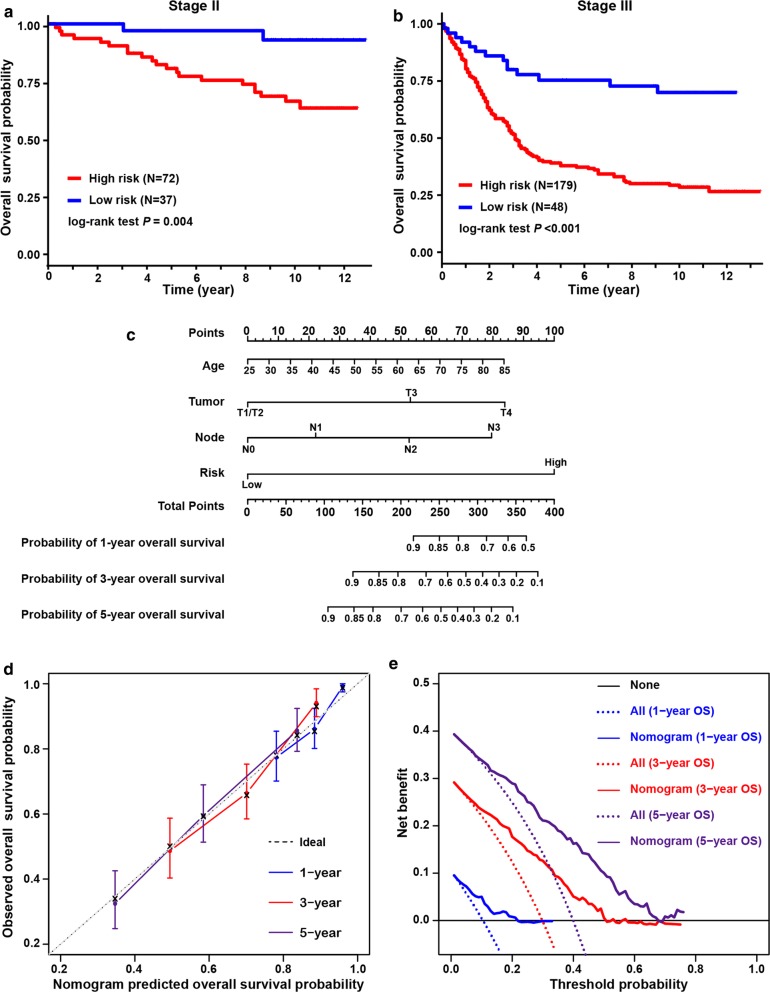
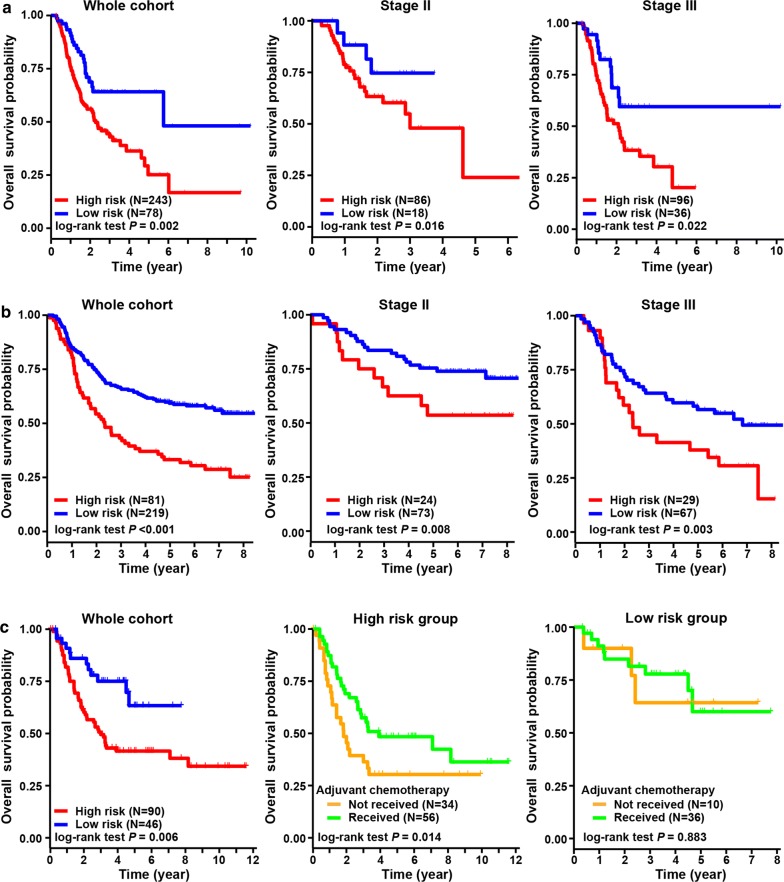
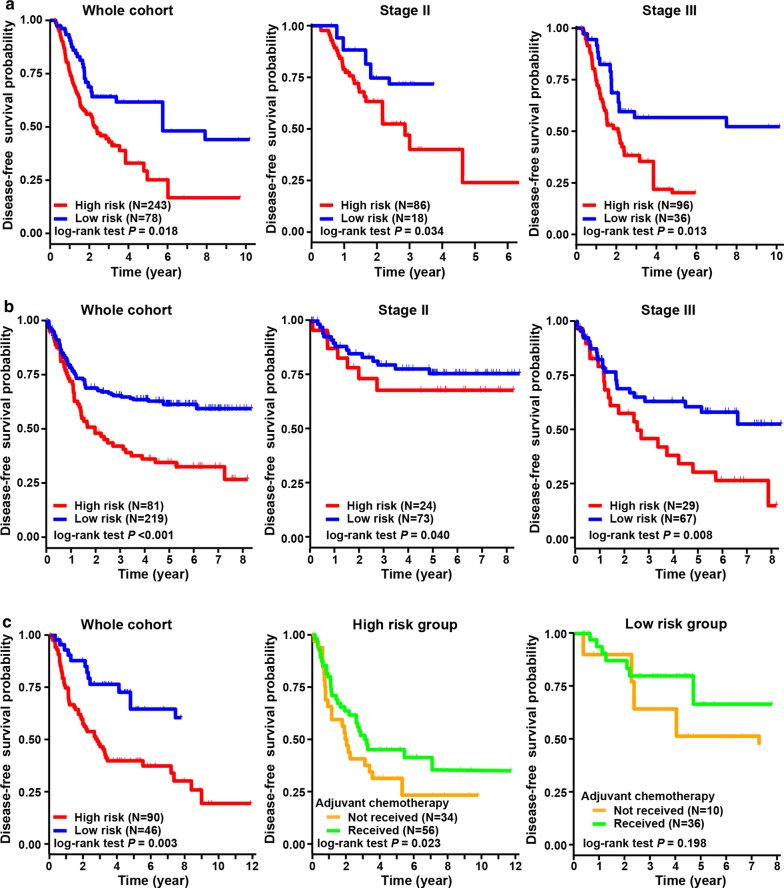
Results: Low hypoxia status (p < 0.001) and high immune status (p = 0.005) were identified as favorable factors for patients' overall survival. By using the LASSO model, four genes, including CXCR6, PPP1R14A and TAGLN, were identified to construct a gene signature for risk stratification. In the discovery cohort (n = 357), patients with low risk yielded better outcomes than those with high risk regarding overall survival across and within TNM stage subgroups. Multivariate analysis identified the hypoxia-immune-based gene signature as an independent prognostic factor (p < 0.001). A nomogram integrating the gene signature and known risk factors yielded better performance and net benefits in calibration and decision curve analyses. Similar results were validated in the TCGA (n = 321) and two independent GEO (n = 300 and n = 136, respectively) cohorts.

Conclusions: The hypoxia-immune-based gene signature represents a promising tool for risk stratification tool in gastric cancer. It might serve as a prognostic classifier for clinical decision-making regarding individualized prognostication and treatment, and follow-up scheduling.

Keywords: Gastric cancer; Hypoxia; Immune; Microenvironment; Prediction; Prognosis.


Conflict of interest statement

The authors declare that they have no competing interests.

Figures

Fig. 1
Fig. 1
Identification of hypoxia and immune status and hypoxia- and immune-related DEGs. a Dot plot for three distinct clusters identified by t-SNE algorithm based on 200 hypoxia hallmark genes. b Kaplan–Meier plot of overall survival for patients in three clusters. c Expression changes (hypoxiahigh vs. hypoxialow) of target genes involved in HIF-1 KEGG pathway. d Heatmap showing expression profiles for hypoxia-related DEGs with comparison between hypoxiahigh and hypoxialow groups. e Histogram shows the density distribution for high- and low-immune score groups divided by the optimal cutoff. f Scatter plot shows the standardized log-rank statistic value for each corresponding immune score cutoff. The optimal cutoff with the maximum standard log-rank statistic is marked with a vertical dashed line. g Kaplan–Meier plot of overall survival for patients in immunehigh and immunelow groups. h Heatmap showing expression profiles for immune-related DEGs with comparison between immunehigh and immunelow groups
Fig. 2
Fig. 2
Identification and biological function of hypoxia-immune-related protective and risk DEGs. a Kaplan–Meier plot of overall survival for patients in three groups by combining the hypoxia and immune status. b Heatmap showing expression profiles for hypoxia-immune-related DEGs with comparison between hypoxialow/immunehigh and hypoxiahigh/immunelow groups. c, d Venn diagrams show overlaps of hypoxia-immune-related DEGs with hypoxia-related and immune-related DEGs for identification of protective and risk DEGs. e, f Representative Gene Ontology terms enriched by the hypoxia-immune-related protective and risk DEGs. P-values were adjusted by false discovery rate
Fig. 3
Fig. 3
Hypoxia-immune-based gene signature and prognosis classifier. a Forest plot of hazard ratios for 39 hypoxia-immune-related prognostic DEGs. b Three-fold cross-validation for tuning parameter selection in the LASSO model. The partial likelihood deviance is plotted against log (λ), where λ is the tuning parameter. Partial likelihood deviance values are shown, with error bars representing SE. The dotted vertical lines are drawn at the optimal values by minimum criteria and 1-SE criteria. c LASSO coefficient profiles of the hypoxia-immune-related prognostic DEGs. The dotted line indicates the value chosen by 3-fold cross-validation. d Scatter plot shows the standardized log-rank statistic value for each corresponding cutoff of hypoxia-immune-based risk score. The optimal cutoff with the maximum standard log-rank statistic is marked with a vertical dashed line. e Distributions of risk score, survival status and expression profile of signature genes. f Kaplan–Meier plot of overall survival for patients in low-risk and high-risk groups by hypoxia-immune-based prognosis classifier in discovery cohort
Fig. 4
Fig. 4
Validation of hypoxia-immune-based prognosis classifier in TNM subgroups and nomogram for predicting overall survival. a, b Kaplan–Meier plot of overall survival for patients in low-risk and high-risk groups by hypoxia-immune-based prognosis classifier in stage II and III subgroups in discovery cohort. c Nomogram developed by using discovery cohort to predict 1-, 3-, and 5-years overall survival probability. d Plot depicting the calibration of the nomogram in terms of the agreement between predicted and observed outcomes. Nomogram performance is shown by the plot relative to the dotted line, which represents perfect prediction. e Decision curve analysis shows the expected net benefits based on the nomogram prediction at different threshold probabilities. None: assume an event will occur in no patients (horizontal solid line); All: assume an event will occur in all patients (dash line)
Fig. 5
Fig. 5
Validation of hypoxia-immune-based prognosis classifier in three independent cohorts regarding overall survival. a Kaplan–Meier plot of overall survival by risk groups for patients in the TCGA cohort and subgroups according to TNM staging. b Kaplan–Meier plot of overall survival by risk groups for patients in the ACRG cohort and subgroups according to TNM staging. c Kaplan–Meier plot of overall survival by risk groups for patients in the CHEM cohort. And overall survival comparison among patients received chemotherapy or not in the low- and high-risk groups
Fig. 6
Fig. 6
Validation of hypoxia-immune-based prognosis classifier in three independent cohorts regarding disease-free survival. a Kaplan–Meier plot of disease-free survival by risk groups for patients in the TCGA cohort and subgroups according to TNM staging. b Kaplan–Meier plot of disease-free survival by risk groups for patients in the ACRG cohort and subgroups according to TNM staging. c Kaplan–Meier plot of disease-free survival by risk groups for patients in the CHEM cohort. And disease-free survival comparison among patients received chemotherapy or not in the low- and high-risk groups

References

    1. Siegel RL, Miller KD, Jemal A. Cancer statistics, 2019. Cancer J Clin. 2019;69(1):7–34. - PubMed
    1. Ajani JA, D’Amico TA, Almhanna K, Bentrem DJ, Chao J, Das P, et al. Gastric cancer, Version 32016, NCCN Clinical Practice Guidelines In Oncology. JNCCN. 2016;14(10):1286–1312. - PubMed
    1. Shah MA, Ajani JA. Gastric cancer–an enigmatic and heterogeneous disease. JAMA. 2010;303(17):1753–1754. - PubMed
    1. Noh SH, Park SR, Yang HK, Chung HC, Chung IJ, Kim SW, et al. Adjuvant capecitabine plus oxaliplatin for gastric cancer after D2 gastrectomy (CLASSIC): 5-year follow-up of an open-label, randomised phase 3 trial. Lancet Oncol. 2014;15(12):1389–1396. - PubMed
    1. Hanahan D, Coussens LM. Accessories to the crime: functions of cells recruited to the tumor microenvironment. Cancer Cell. 2012;21(3):309–322. - PubMed