. 2020 May 14;21(1):360.
doi: 10.1186/s12864-020-6760-4.

Intron and gene size expansion during nervous system evolution

Affiliations

Intron and gene size expansion during nervous system evolution

Matthew J McCoy et al. BMC Genomics. .

Abstract

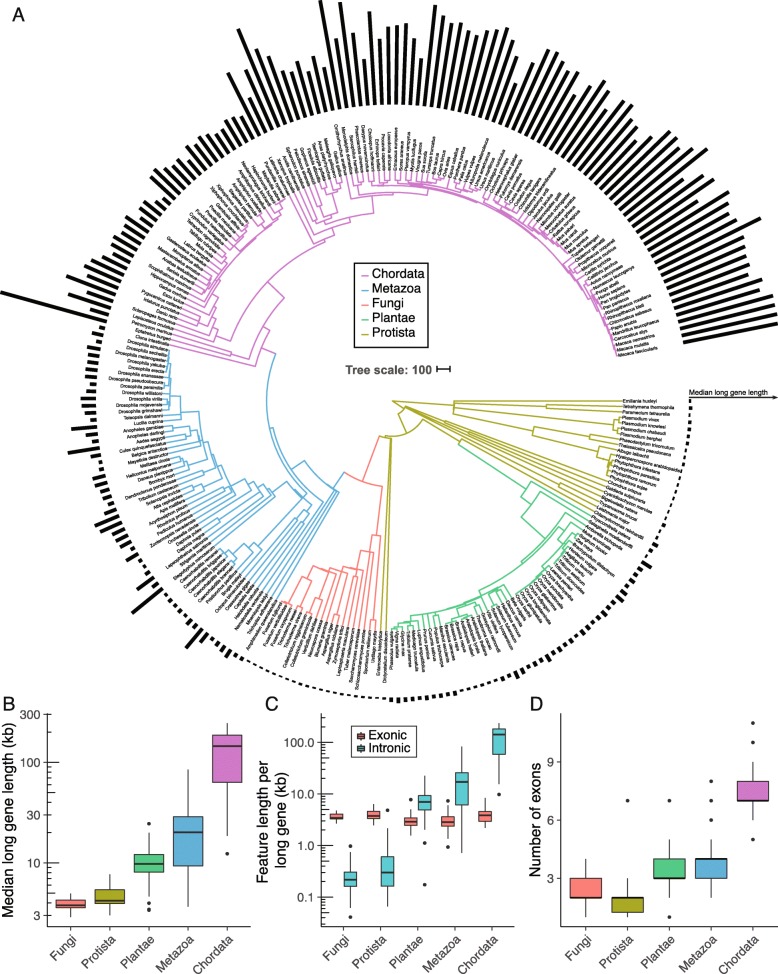
Background: The evolutionary radiation of animals was accompanied by extensive expansion of gene and genome sizes, increased isoform diversity, and complexity of regulation.

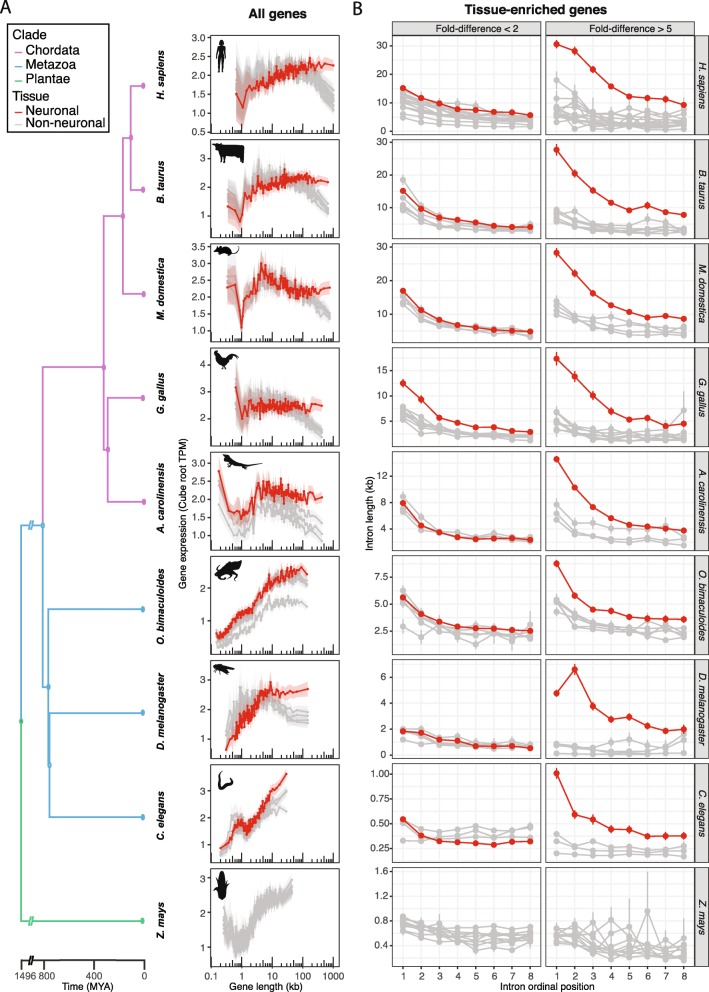
Results: Here we show that the longest genes are enriched for expression in neuronal tissues of diverse vertebrates and of invertebrates. Additionally, we show that neuronal gene size expansion occurred predominantly through net gains in intron size, with a positional bias toward the 5' end of each gene.

Conclusions: We find that intron and gene size expansion is a feature of many genes whose expression is enriched in nervous systems. We speculate that unique attributes of neurons may subject neuronal genes to evolutionary forces favoring net size expansion. This process could be associated with tissue-specific constraints on gene function and/or the evolution of increasingly complex gene regulation in nervous systems.

Keywords: Gene size; Genome evolution; Intron size; Long genes; Long introns; Nervous system evolution.


Conflict of interest statement

The authors declare that they have no competing interests.

Figures

Fig. 1
Fig. 1
Neuronal intron and gene size expansion in diverse animal species. a Expression of the longest genes is enriched in neuronal tissues of vertebrates and invertebrates. Each plot shows smooth-quantile-normalized transcriptome data across multiple tissues or cell types from individual species. Each line represents mean gene expression in cube root transcripts per million (TPM) versus gene length (kb). Genes were segregated into 100 bins according to gene length, and points show average gene length of each bin. Transparent ribbons show 95% confidence intervals. Red lines show neuronal tissues and grey lines show non-neuronal tissues (see Additional file 2: Table S1 for a full list of tissues for each species). Tissue transcriptomes were obtained from the EMBL Expression Atlas [21] for all species except Drosophila melanogaster [18] and Octopus bimaculoides [19]. Branch lengths for the phylogenetic tree were obtained from TimeTree.org [22]. Organism outlines were depicted by author MJM from the following image references in accordance with respective licensing: Homo sapiens [23]; Bos taurus [24]; Monodelphis domestica [25]; Gallus gallus [26]; Anolis carolinensis [27]; Octopus bimaculoides [28]; Drosophila melanogaster [29]; Caenorhabditis elegans [30]; and Zea mays [31]. b Mean intron length (kb) versus ordinal position in neuronal (red) and non-neuronal tissues (grey) across the same species presented in Fig. 1a. Genes with only slight expression fold-difference of the top expressing tissue over the next highest-expressing tissue (< 2 fold-difference; left) are contrasted against genes with more than 5 fold-difference in expression (right). Error bars show standard error
Fig. 2
Fig. 2
Differential gene size expansion during animal evolution. a Phylogenomic tree showing median gene length of the top 10% longest genes in each genome as a bargraph. All eukaryotic kingdoms are represented, with Metazoa further subdivided into animals with notochords (Chordata) and animals without notochords (here labeled as Metazoa). Branch lengths were obtained from TimeTree.org [22], and scale bar shows 100 million years. b Boxplots of median gene length of long genes of each genome in kilobases aggregated by clade. c Boxplots of long gene intronic sequence versus exonic sequence per clade. d Boxplots showing median number of exons of each gene for each species grouped by clade. This extends similar analyses by Lynch et al. [40] and Francis and Wörheide [39] of exon/intron content

References

    1. Lynch M, Conery JS. The origins of genome complexity. Science. 2003;302(5649):1401–1404. doi: 10.1126/science.1089370. - DOI - PubMed
    1. Huff JT, Zilberman D, Roy SW. Mechanism for DNA transposons to generate introns on genomic scales. Nature. 2016;538(7626):533–536. doi: 10.1038/nature20110. - DOI - PMC - PubMed
    1. Rodriguez F, Arkhipova IR. Transposable elements and polyploid evolution in animals. Curr Opin Genet Dev. 2018;49:115–123. doi: 10.1016/j.gde.2018.04.003. - DOI - PMC - PubMed
    1. Wendel JF, Lisch D, Hu G, Mason AS. The long and short of doubling down: polyploidy, epigenetics, and the temporal dynamics of genome fractionation. Curr Opin Genet Dev. 2018;49:1–7. doi: 10.1016/j.gde.2018.01.004. - DOI - PubMed
    1. Petrov DA. Evolution of genome size: new approaches to an old problem. Trends Genet. 2001;17(1):23–28. doi: 10.1016/S0168-9525(00)02157-0. - DOI - PubMed