. 2020 May 15:9:e55053.
doi: 10.7554/eLife.55053.

Identification of novel, clinically correlated autoantigens in the monogenic autoimmune syndrome APS1 by proteome-wide PhIP-Seq

Affiliations

Identification of novel, clinically correlated autoantigens in the monogenic autoimmune syndrome APS1 by proteome-wide PhIP-Seq

Sara E Vazquez et al. Elife. .

Abstract

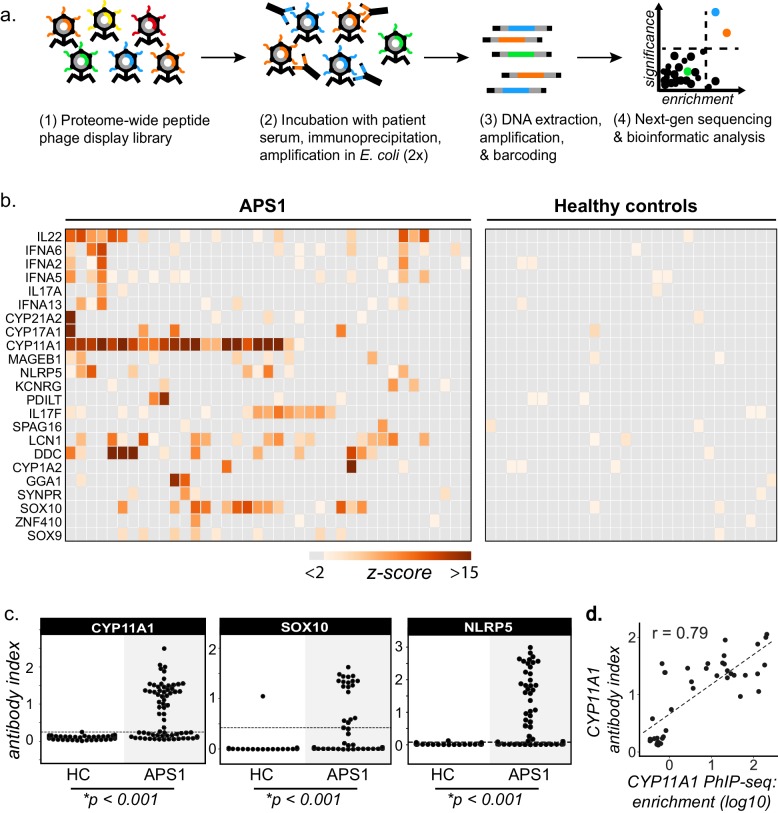
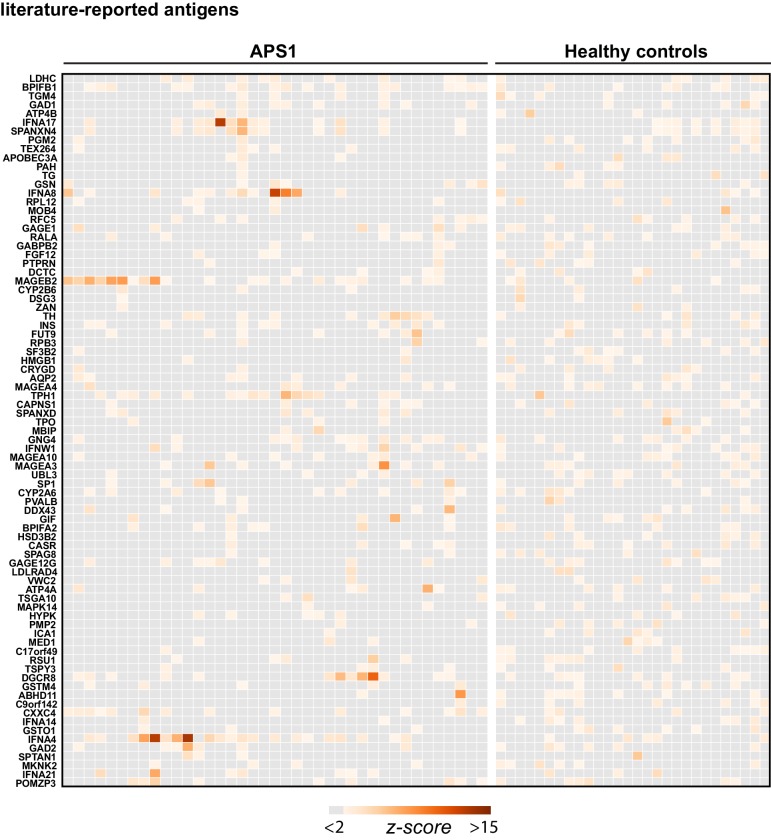
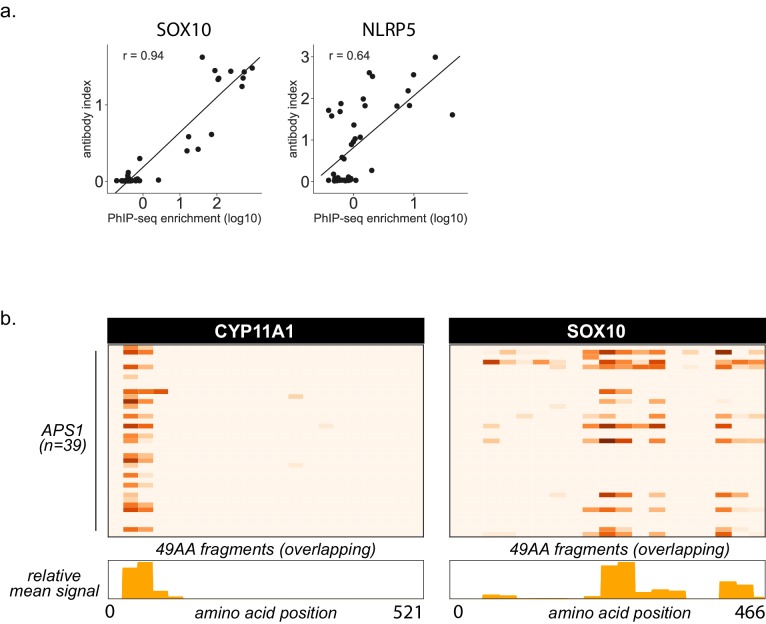
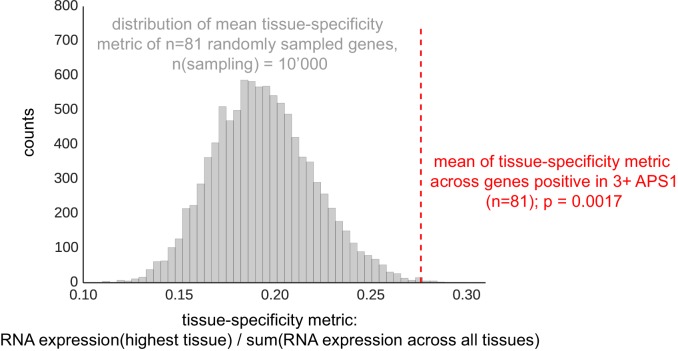
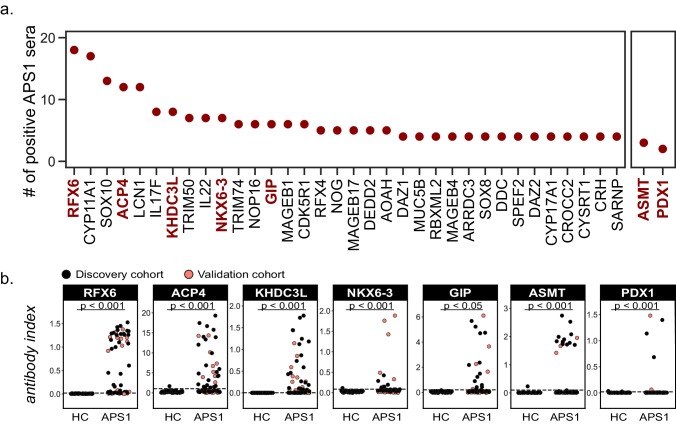
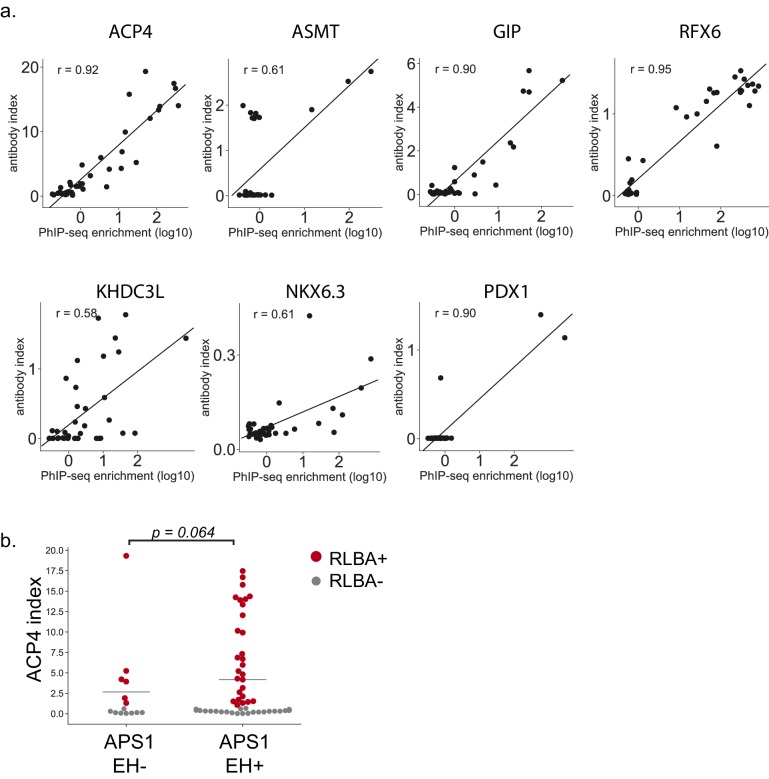
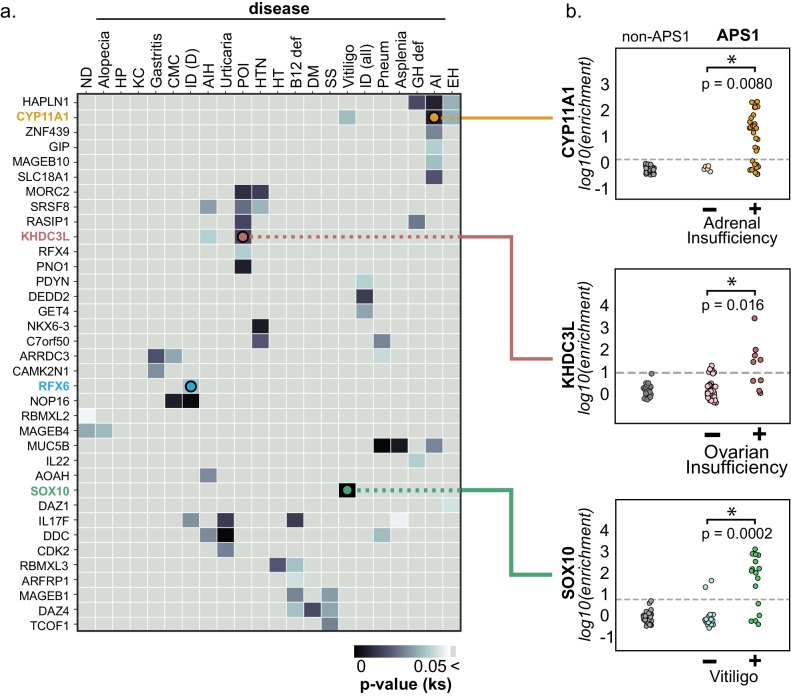
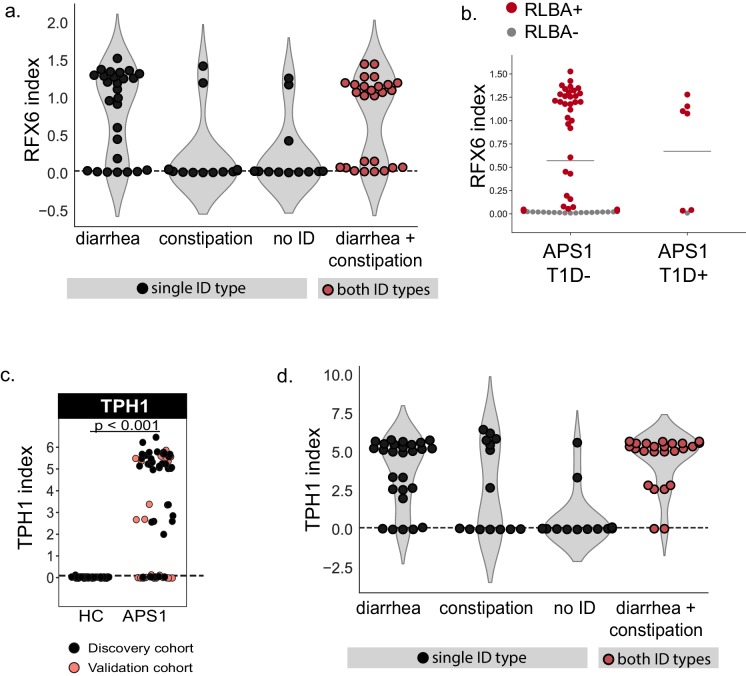
The identification of autoantigens remains a critical challenge for understanding and treating autoimmune diseases. Autoimmune polyendocrine syndrome type 1 (APS1), a rare monogenic form of autoimmunity, presents as widespread autoimmunity with T and B cell responses to multiple organs. Importantly, autoantibody discovery in APS1 can illuminate fundamental disease pathogenesis, and many of the antigens found in APS1 extend to more common autoimmune diseases. Here, we performed proteome-wide programmable phage-display (PhIP-Seq) on sera from a cohort of people with APS1 and discovered multiple common antibody targets. These novel APS1 autoantigens exhibit tissue-restricted expression, including expression in enteroendocrine cells, pineal gland, and dental enamel. Using detailed clinical phenotyping, we find novel associations between autoantibodies and organ-restricted autoimmunity, including a link between anti-KHDC3L autoantibodies and premature ovarian insufficiency, and between anti-RFX6 autoantibodies and diarrheal-type intestinal dysfunction. Our study highlights the utility of PhIP-Seq for extensively interrogating antigenic repertoires in human autoimmunity and the importance of antigen discovery for improved understanding of disease mechanisms.

Keywords: APECED; PhIP-Seq; autoantigens; autoimmunity; enteroendocrine cells; human; human biology; immunology; inflammation; medicine; ovarian insufficiency.

Plain language summary

The immune system uses antibodies to fight microbes that cause disease. White blood cells pump antibodies into the bloodstream, and these antibodies latch onto bacteria and viruses, targeting them for destruction. But sometimes, the immune system gets it wrong. In autoimmune diseases, white blood cells mistakenly make antibodies that target the body's own tissues. Detecting these 'autoantibodies' in the blood can help doctors to diagnose autoimmune diseases. But the identities and targets of many autoantibodies remain unknown. In one rare disease, called autoimmune polyendocrine syndrome type 1 (APS-1), a faulty gene makes the immune system much more likely to make autoantibodies. People with this disease can develop an autoimmune response against many different healthy organs. Although APS-1 is rare, some of the autoantibodies made by individuals with the disease are the same as the ones in more common autoimmune diseases, like type 1 diabetes. Therefore, investigating the other autoantibodies produced by individuals with APS-1 could reveal the autoantibodies driving other autoimmune diseases. Autoantibodies bind to specific regions of healthy proteins, and one way to identify them is to use hundreds of thousands of tiny viruses in a technique called proteome-wide programmable phage-display, or PhIP-Seq. Each phage carries one type of protein segment. When mixed with blood serum from a patient, the autoantibodies stick to the phages that carry the target proteins for that autoantibody. These complexes can be isolated using biochemical techniques. Sequencing the genes of these phages then reveals the identity of the autoantibodies’ targets. Using this technique, Vazquez et al successfully pulled 23 known autoantibodies from the serum of patients with APS-1. Then, experiments to search for new targets began. This revealed many new autoantibodies, targeting proteins found only in specific tissues. They included one that targets a protein found on cells in the gut, and another that targets a protein found on egg cells in the ovaries. Matching the PhIP-Seq data to patient symptoms confirmed that these new antibodies correlate with the features of specific autoimmune diseases. For example, patients with antibodies that targeted the gut protein were more likely to have gut symptoms, while patients with antibodies that targeted the egg cell protein were more likely to have problems with their ovaries. Further investigations using PhIP-Seq could reveal the identities of even more autoantibodies. This might pave the way for new antibody tests to diagnose autoimmune diseases and identify tissues at risk of damage. This could be useful not only for people with APS-1, but also for more common autoimmune diseases that target the same organs.


Conflict of interest statement

SV JD, MSA, and SEV have a provisional patent on clinical application of autoantigens described in this study. EF, DS, SS, BM, CM, ZQ, AC, MC, MG, ML No competing interests declared, JD JD is a scientific advisory board member of Allen and Company. JD, MSA, and SEV have a provisional patent on clinical application of autoantigens described in this study. MA MSA owns stock in Merck and Medtronic. JD, MSA, and SEV have a provisional patent on clinical application of autoantigens described in this study.

Figures

Figure 1.
Figure 1.. PhIP-Seq identifies literature-reported autoantigens in APS1.
(A) Overview of PhIP-Seq experimental workflow. (B) PhIP-Seq identifies known autoantibody targets in APS1. Hierarchically clustered (Pearson) z-scored heatmap of literature reported autoantigens with 10-fold or greater signal over mock-IP in at least 2/39 APS1 sera and in 0/28 non-APS1 control sera. (C) Radioligand binding assay (RLBA) orthogonal validation of literature-reported antigens CYP11A1, SOX10, and NLRP5 within the expanded cohort of APS1 (n = 67) and non-APS1 controls (n = 61); p-value was calculated across all samples using a Mann-Whitney U test. Dashed line indicates mean of healthy control signal + 3 standard deviations. (D) CYP11A1 RLBA antibody index and CYP11A1 PhIP-Seq enrichment are well correlated (Pearson, r = 0.79).
Figure 1—figure supplement 1.
Figure 1—figure supplement 1.. Hierarchically clustered (Pearson) z-scored heatmap of literature reported autoantigens that did not meet the cutoff of 10-fold or greater signal over mock-IP in at least 2/39 APS1 sera and in 0/28 non-APS1 control sera.
Figure 1—figure supplement 2.
Figure 1—figure supplement 2.. Additional PhIP-Seq data for known autoantigens SOX10 and NLRP5.
(A) Scatterplot of individual PhIP-Seq enrichment values (log10) over mock-IP as compared to radioligand binding assay antibody index values (1 = commercial antibody signal) for known antigens SOX10 and NLRP5, with Pearson correlation coefficient r. (B) PhIP-Seq enables 49 amino acid resolution of antibody signal from APS1 sera to literature-reported antigens CYP11A1 and SOX10. Top panels: PhIP-Seq signal (fold-change of each peptide as compared to signal from mock-IP, log10-scaled) for fragments 1–21 for CYP11A1 and fragments 1–19 for SOX10. Bottom panels: Trace of normalized signal for CYP11A1 and SOX10 fragments across the mean of all 39 APS1 sera.
Figure 2.
Figure 2.. PhIP-Seq identifies novel (and known) antigens across multiple APS1 sera.
(A) Hierarchically clustered (Pearson) z-scored heatmap of all genes with 10-fold or greater signal over mock-IP in at least 3/39 APS1 sera and in 0/28 non-APS1 sera. Black labeled antigens (n = 69) are potentially novel and grey labeled antigens (n = 12) are previously literature-reported antigens.
Figure 2—figure supplement 1.
Figure 2—figure supplement 1.. The mean of tissue-specificity ratio of 81 PhIP-Seq antigens (Figure 2) is increased as compared to the tissue-specificity ratio of n = 81 randomly sampled genes (n-sampling = 10’000).
Data from Protein Atlas, HPA/Gtex/Fantom5 RNA consensus dataset (https://www.proteinatlas.org/about/download; Uhlén et al., 2015).
Figure 3.
Figure 3.. Novel PhIP-Seq autoantigens are shared across multiple APS1 samples and validate in whole protein binding assays.
(A) Graph of the PhIP-seq autoantigens from Figure 2 that were shared across the highest number of individual APS1 sera (left panel). ASMT and PDX1 were positive hits in 3 and 2 sera, respectively, but are known to be highly tissue specific (right panel). Genes in red were chosen for validation in whole protein binding assay. (B) Validation of novel PhIP-Seq antigens by radiolabeled binding assay, with discovery cohort (black, nAPS1 = 39), validation cohort (light red, nAPS1 = 28) and non-APS1 control cohort (nHC = 61). P-value was calculated across all samples using a Mann-Whitney U test. Dashed line indicates mean of healthy control signal + 3 standard deviations.
Figure 3—figure supplement 1.
Figure 3—figure supplement 1.. Comparison of PhIP-Seq data to orthonongal whole-protein binding assays.
(A) Scatterplot of individual PhIP-Seq enrichment values (log10) over mock-IP as compared to radioligand binding assay antibody index values (1 = commercial antibody signal) for novel antigens ACP4, ASMT, GIP, RFX6, KHDC3L, NKX6.3, and PDX1, with Pearson correlation coefficient r (Note that for PDX1, there are insufficient positive data points for the correlation to be meaningful). (B) ACP4 RLBA autoantibody index, broken down by enamel hypoplasia (EH) status.
Figure 4.
Figure 4.. PhIP-Seq reproduces known clinical associations with anti-CYP11A1 and anti-SOX10 antibodies.
(A) Heatmap of p-values (Kolmogorov-Smirnov testing) for differences in gene enrichments for individuals with versus without each clinical phenotype. Significant p-values in the negative direction (where mean PhIP-Seq enrichment is higher in individuals without disease) are masked (colored as p>0.05). (B) Anti-CYP11A1 PhIP-Seq enrichments are significantly different between APS1 patients with and without adrenal insufficiency (top panel; Kolmogorov-Smirnov test). Anti-SOX10 PhIP-Seq enrichments are significantly different between APS1 patients with and without Vitiligo (bottom panel). Anti-KHDC3L PhIP-Seq enrichments are significantly different between APS1 patients with and without ovarian insufficiency (middle panel). ND, nail dystrophy. HP, hypoparathyroidism. KC, keratoconjunctivitis. CMC, chronic mucocutaneous candidiasis. ID (D), Intestinal dysfunction (diarrheal-type). AIH, autoimmune hepatitis. POI, primary ovarian insufficiency. HTN, hypertension. HT, hypothyroidism. B12 def, B12 (vitamin) deficiency. DM, diabetes mellitus. SS, Sjogren’s-like syndrome. Pneum, Pneumonitis. GH def, Growth hormone deficiency. AI, Adrenal Insufficiency. EH, (dental) enamel hypoplasia.
Figure 4—figure supplement 1.
Figure 4—figure supplement 1.. Clustered disease correlations in the APS1 cohort (Spearman’s rank correlation; n = 67).
Figure 4—figure supplement 2.
Figure 4—figure supplement 2.. KHDC3L is highly expressed in oocytes (top), but not in granulosa cells (bottom).
In contrast, SRSF8 and PNO1 are highly expressed in granulosa cells (GCs), but not in oocytes. Data from Zhang et al. (2018).
Figure 5.
Figure 5.. Autoantibodies to oocyte-expressed protein KHDC3L are associated with ovarian insufficiency.
(A) Principle component analysis of transcriptome of single human oocytes (red) and granulosa cells (GCs, blue); data re-analyzed from Zhang et al. (2018). KHDC3L is highly expressed in oocytes, along with binding partner NLRP5 and known oocyte marker DDX4. For comparison, known GC markers INHBA and AMH are primarily expressed in the GC population. (B) APS1 sera that are positive for one of anti-KHDC3L and anti-NLRP5 autoantibodies tend to also be positive for the other. (C) Antibody indices for both KHDC3L and NLRP5 are increased in females with APS1. (D) Antibody indices for females with APS1 by age; All 10 patients with primary ovarian insufficiency (POI) are positive for anti-KHDC3L antibodies. Of note, many of the individuals with anti-KHDC3L antibodies but without POI are younger and therefore cannot be fully evaluated for ovarian insufficiency.
Figure 6.
Figure 6.. APS1 patients with intestinal dysfunction mount an antibody response to intestinal enteroendocrine cells and to enteroendocrine-expressed protein RFX6.
(A) Anti-RFX6 positive APS1 serum with intestinal dysfunction co-stains Chromogranin-A (ChgA) positive enteroendocrine cells in a nuclear pattern (right panel and inset). In contrast, non-APS1 control sera as well as anti-RFX6 negative APS1 serum do not co-stain ChgA+ enteroendocrine cells (left and center panels). (B) Anti-RFX6+ serum, but not anti-RFX6- serum, co-stains HEK293T cells transfected with an RFX6-expressing plasmid (see also: Figure 6—figure supplement 2). (C) Radioligand binding assay (RLBA) anti-RFX6 antibody index is significantly higher across individuals with intestinal dysfunction (ID; Mann-Whitney U, p=0.006). Purple color indicates samples that fall above 6 standard deviations of the mean non-APS1 control RLBA antibody index. (D) Individuals with the diarrheal subtype of ID have a higher frequency of anti-RFX6 antibody positivity as compared to those with constipation-type ID (Mann-Whitney U, p=0.0028) or no ID (p=0.0015).
Figure 6—figure supplement 1.
Figure 6—figure supplement 1.. Higher resolution PhIP-seq and transcriptional data for novel autoantigen RFX6.
(A) PhIP-Seq enables 49 amino acid resolution of antibody signal from novel autoantigen RFX6. PhIP-Seq signal (fold-change of each peptide as compared to signal from mock-IP, log10-scaled) for fragments 1–38 for RFX6 from APS1 sera (n = 39). (B) Single cell RNA expression of Rfx6. Left: normalized RNA expression of Rfx6 in single cells from 20 different organs. Right inset: Rfx6 shares an expression pattern with pancreatic beta-cell marker Ins2 (Schaum et al., 2018). (C) Single cell RNA expression of Rfx6. Left: normalized RNA expression of Rfx6 in single cells from the intestine. Right inset: Rfx6 shares an expression pattern with intestinal enteroendocrine cell marker ChgA (Schaum et al., 2018).
Figure 6—figure supplement 2.
Figure 6—figure supplement 2.. Anti-RFX6+ sera (top two panels), but not anti-RFX6- serum or non-APS1 control serum (bottom two panels), co-stain HEK293T cells transfected with an RFX6-expressing plasmid.
None of the sera tested stain 293T cells transfected with empty vector (‘mock’). No cross-reactivity of secondary antibodies was observed (right panel).
Figure 6—figure supplement 3.
Figure 6—figure supplement 3.. Extended validation and clinical correlations for intestinal antigens RFX6 and TPH1.
(A) APS1 patients with the diarrheal subtype, as well as those with both subtypes of ID (red), have increased anti-RFX6 antibody signal by RLBA as compared to those with constipation-type ID or no ID. (B) 6/7 (6 diagnosed prior to serum draw, 1 diagnosed post serum draw) APS1 patients with type 1 diabetes have positive anti-RFX6 signal by RLBA. (C) Validation of known ID-associated antigen TPH1 by radiolabeled binding assay, with discovery cohort (black, nAPS1 = 39), validation cohort (light red, nAPS1 = 28) and non-APS1 control cohort (nHC = 61). P-value was calculated across all samples using a Mann-Whitney U test. (D) APS1 patients with ID have increased anti-TPH1 antibody signal by RLBA as compared to those with no ID. However, anti-TPH1 antibodies are distributed across both types (diarrheal- and constipation-type) of ID, in comparison to anti-RFX6 antibodies which are enriched primarily in the diarrheal ID subtype.

References

    1. Aaltonen J, Björses P, Perheentupa J, Horelli–Kuitunen N, Palotie A, Peltonen L, Lee YS, Francis F, Henning S, Thiel C, Leharach H, Yaspo M–L, Yaspo M, Finnish-German APECED Consortium An autoimmune disease, APECED, caused by mutations in a novel gene featuring two PHD-type zinc-finger domains. Nature Genetics. 1997;17:399–403. doi: 10.1038/ng1297-399. - DOI - PubMed
    1. Ackermann K, Bux R, Rüb U, Korf HW, Kauert G, Stehle JH. Characterization of human melatonin synthesis using autoptic pineal tissue. Endocrinology. 2006;147:3235–3242. doi: 10.1210/en.2006-0043. - DOI - PubMed
    1. Adriaenssens AE, Biggs EK, Darwish T, Tadross J, Sukthankar T, Girish M, Polex-Wolf J, Lam BY, Zvetkova I, Pan W, Chiarugi D, Yeo GSH, Blouet C, Gribble FM, Reimann F. Glucose-Dependent insulinotropic polypeptide Receptor-Expressing cells in the hypothalamus regulate food intake. Cell Metabolism. 2019;30:987–996. doi: 10.1016/j.cmet.2019.07.013. - DOI - PMC - PubMed
    1. Ahonen P, Myllärniemi S, Sipilä I, Perheentupa J. Clinical variation of autoimmune polyendocrinopathy-candidiasis-ectodermal dystrophy (APECED) in a series of 68 patients. New England Journal of Medicine. 1990;322:1829–1836. doi: 10.1056/NEJM199006283222601. - DOI - PubMed
    1. Akoury E, Zhang L, Ao A, Slim R. NLRP7 and KHDC3L, the two maternal-effect proteins responsible for recurrent hydatidiform moles, co-localize to the oocyte cytoskeleton. Human Reproduction. 2015;30:159–169. doi: 10.1093/humrep/deu291. - DOI - PubMed

Publication types

MeSH terms

Supplementary concepts