. 2020 Apr 28;53(2):21-31.
doi: 10.1267/ahc.20008. Epub 2020 Apr 25.

New Insights into the Pathogenesis of Diabetic Nephropathy: Proximal Renal Tubules Are Primary Target of Oxidative Stress in Diabetic Kidney

Affiliations

New Insights into the Pathogenesis of Diabetic Nephropathy: Proximal Renal Tubules Are Primary Target of Oxidative Stress in Diabetic Kidney

Ryuma Haraguchi et al. Acta Histochem Cytochem. .

Abstract

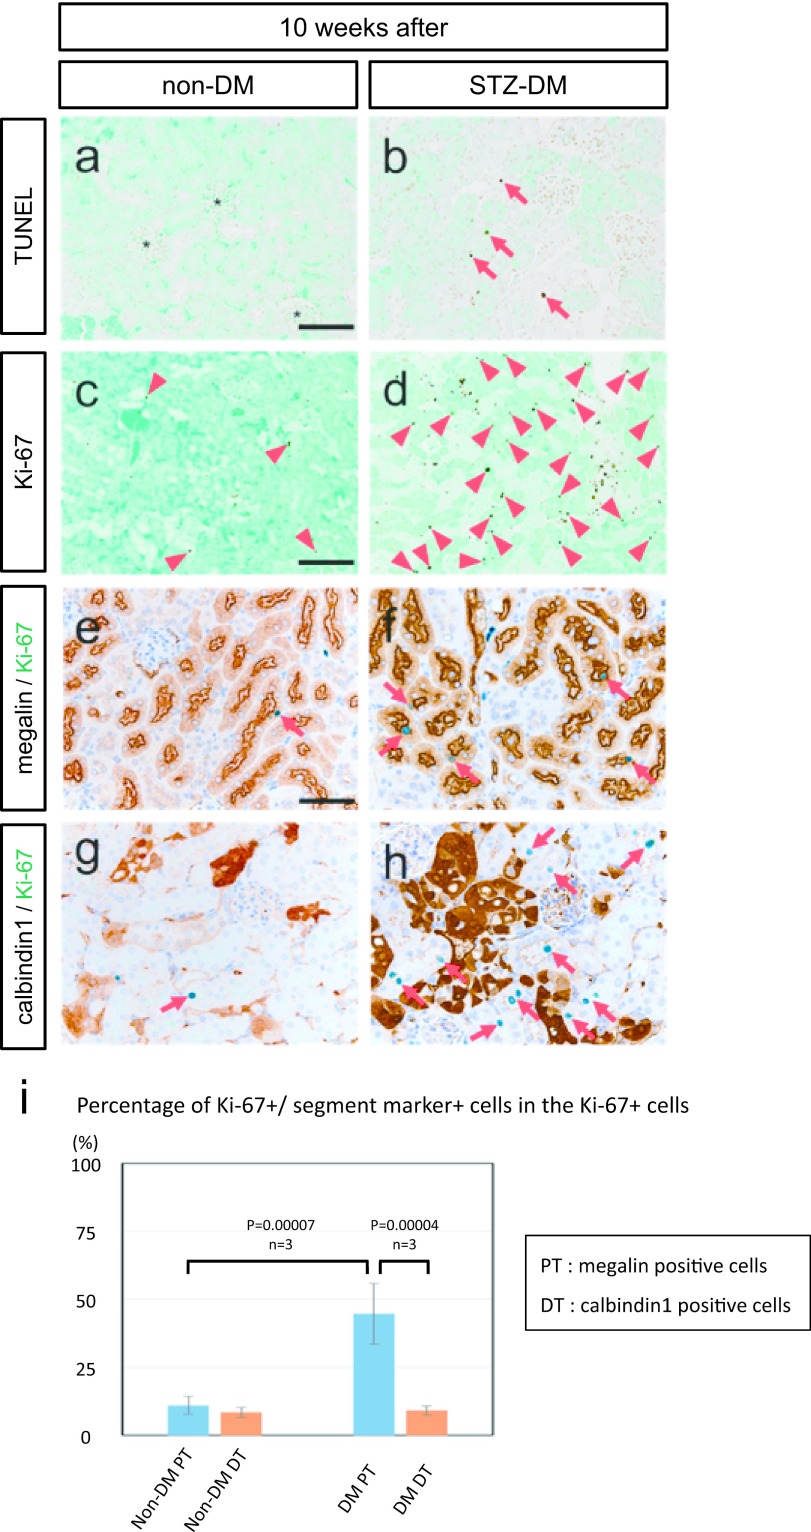
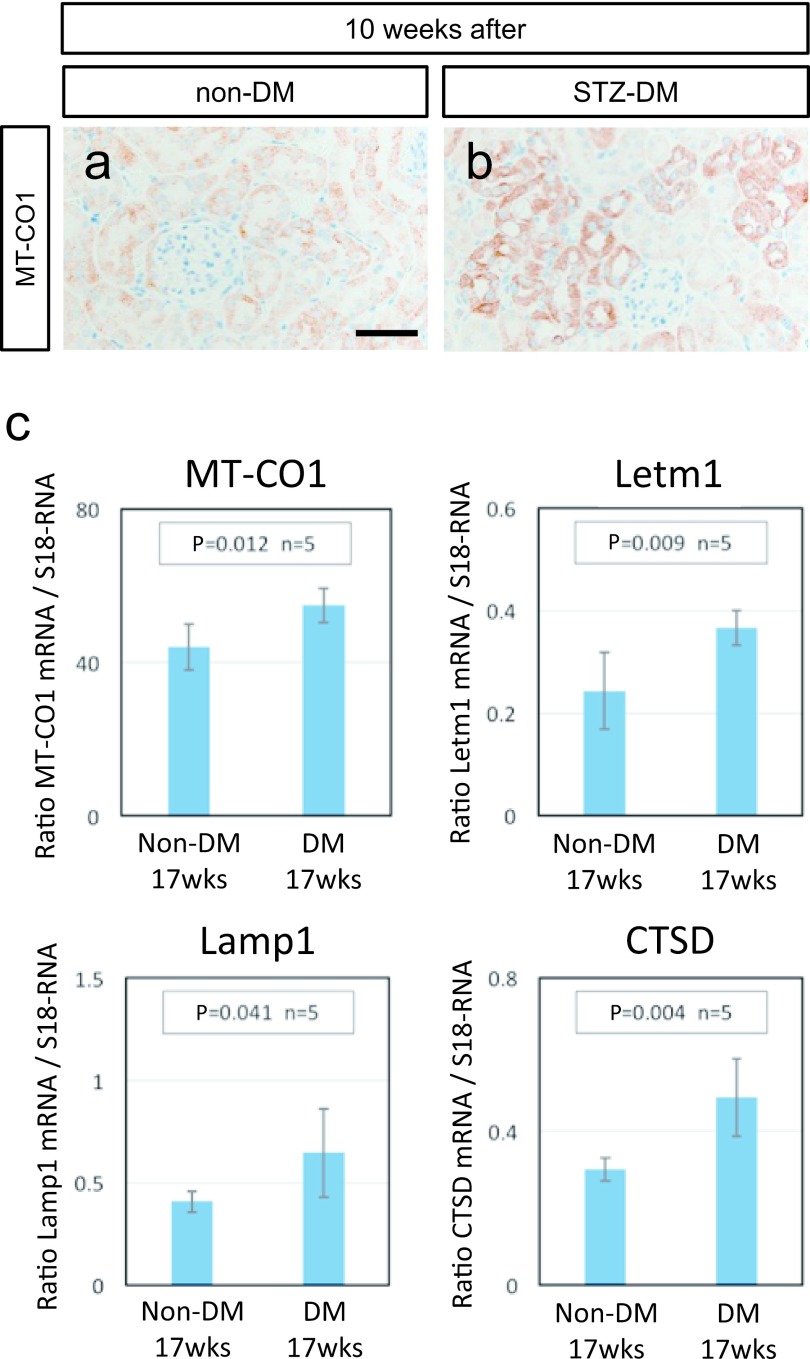
Diabetic nephropathy is a major source of end-stage renal failure, affecting about one-third cases of diabetes mellitus. It has long been accepted that diabetic nephropathy is mainly characterized by glomerular defects, while clinical observations have implied that renal tubular damage is closely linked to kidney dysfunction at the early stages of diabetic nephropathy. In this study, we conducted pathohistological analyses focusing on renal tubular lesions in the early-stage diabetic kidney with the use of a streptozotocin (STZ)-induced diabetes mellitus mouse model. The results revealed that histological alterations in renal tubules, shown by a vacuolar nucleic structure, accumulations of PAS-positive substance, and accelerated restoration stress, occur initially without the presence of glomerular lesions in the early-stage diabetic kidney, and that these tubular defects are localized mainly in proximal renal tubules. Moreover, enhanced expression of RAGE, suggesting an aberrant activation of AGEs-RAGE signaling pathway, and accumulation of oxidative modified mitochondria through the impaired autophagy/lysosome system, were also seen in the damaged diabetic proximal renal tubules. Our findings indicate that proximal tubular defects are the initial pathological events increasingly linked to the progression of diabetic nephropathy, and that controlling renal tubular damage could be an effective therapeutic strategy for the clinical treatment of diabetic nephropathy.

Keywords: AGEs; RAGE; diabetic nephropathy; oxidative stress; proximal renal tubule.


Conflict of interest statement

VThe authors declare no conflicts of interest.

Figures

Fig. 1.
Fig. 1.
Histological presentation of the renal cortex of control and STZ-induced diabetic mice. (a) The upper panel shows the experimental schedule for STZ administration and renal tissues collection. Body weight and blood glucose levels in non-DM (n = 6) and STZ-DM (n = 14) mice are shown in the lower graphs. Data are shown as the means ± SD. *P < 0.05. (b–m) Representative micrographs of hematoxylin and eosin (HE, b–e, h–k) and Periodic acid–Schiff (PAS, f, g, l, m) staining of renal tissues 10 and 25 weeks after STZ administration. (d, j, f, l) Non-DM mice show normal glomerulus and proximal tubules with intact brush borders (arrowheads in f, l). (e, k, g, m) STZ-DM mice show disturbed tubular architecture with unclear brush borders and accumulation of PAS-positive substance in cytoplasm (arrows in g, m). (e) Black-bordered higher magnification micrograph shows a representative image of the enlarged and vacuolar nuclei (indicated by arrows) in STZ-DM kidney. (b–g) The glomerular structure and number shows no significant difference between non-DM and STZ-DM mice at 10 weeks after STZ administration. Twenty-five weeks after STZ administration, severe renal damage, decreased number of intact glomerulus (i), glomerulosclerosis (arrowheads in k, m) and progressive fibrosis (asterisk in k), are observed in renal tissue of STZ-DM. Asterisk in (b, c, h, i) marks glomerulus. Bars = 100 μm (b, c, h, i, f, g, l, m) and 50 μm (d, e, j, k).
Fig. 2.
Fig. 2.
Change in proximal and distal tubule distribution in STZ-DM renal tissue. (a–d) Immunostaining of proximal tubules with anti-megalin antibody, and distal tubules with anti-calbindin1 antibody, shows increased megalin-positive proximal tubules and calbindin1-positive distal tubules in the STZ-DM kidney. (e, f) Double immunostaining with megalin and calbindin1. (e) Reciprocal distribution of megalin and calbindin1 protein and a few calbindin1-positive tubules show weak megalin immunoreactivity (arrows). (f) Most renal tubules with nuclear inclusions show an enlarged mosaic pattern of megalin/calbindin1 protein expression in STZ-DM (red arrows). Asterisks show glomerulus. Signal detection was carried out with DAB (brown signal) and 3,3'-diaminobenzidine tetrahydrochloride dihydrate (HistoGreen; green signal); sections were counterstained with hematoxylin. Bars = 50 μm (a–f). (g) qRT-PCR of megalin and calbindin1 genes. Transcript levels are normalized to S18-RNA values. Error bars indicate the means ± SD (n = 6): megalin: 0.66 ± 0.35 for non-DM kidney and 1.11 ± 0.26 for STZ-DM kidney; calbindin1: 0.27 ± 0.07 for non-DM kidney and 0.54 ± 0.08 for STZ-DM kidney. Statistical significance was determined by unpaired Student’s t-test.
Fig. 3.
Fig. 3.
Cellular apoptosis and proliferation in STZ-DM kidney. (a, b) TUNEL staining and (c, d) Ki-67 immunostaining. Almost all tubules are negative for TUNEL staining in non-DM mice (a). In STZ-DM mice, TUNEL-positive renal tubules are observed (red arrows in b). Ki-67 positive cells are significantly increased in STZ-DM renal tissues (red arrowheads in d). (e–h) Double immunostaining with Ki-67 plus megalin and calbindin1. Increased Ki-67 positive cells in STZ-DM kidney are localized mostly in renal tubules with megalin immunoreactivity (red arrows in f). Asterisks in (a) mark glomeruli. Signal detection was carried out with DAB (brown signal) and 3,3'-diaminobenzidine tetrahydrochloride dihydrate (HistoGreen; green signal); sections were counterstained with hematoxylin or light green. Bars = 100 μm (a, b), 200 μm (c, d) and 50 μm (e–h). (i) The percentage of Ki-67/segment marker double positive cells in Ki-67 positive cells in the cortex of non-DM and STZ-DM kidney. See “Materials and Methods” for counting the number of Ki-67-positive or segment marker-positive cells. Error bars indicate the means ± SD (n = 3): 11.01 ± 3.32 for non-DM kidney PT; 8.43 ± 1.91 for non-DM kidney DT; 44.68 ± 11.18 for STZ-DM kidney PT and 9.16 ± 1.66 for STZ-DM kidney DT. Statistical significance was determined by unpaired Student’s t-test.
Fig. 4.
Fig. 4.
Oxidative stress in STZ-DM kidney. (a–f) Sections immunostained with anti-8-OHdG, anti-AGEs and anti-RAGE as markers of cellar oxidative stress. (b) Strong 8-OHdG signals are observed in the cytoplasm of renal tubules. Some part of glomerulus is also positive for 8-OHdG (black arrowheads). (d) Renal tubules and glomerulus show strong AGEs immunoreactivity (red arrows and black arrowheads). (f) RAGE-positive cells are significantly increased in STZ-DM renal tissue. Red arrowheads in (f) indicate strong expression of RAGE protein. (g, h) Double immunostaining of calbindin1 and RAGE. Red arrowheads in (h) indicate strong expression of RAGE protein. No overlap of RAGE/calbindin1 expression is present in distal renal tubules (red arrows in h). Asterisk in (a) marks glomerulus. Signal detection was carried out with DAB (brown signal) and 3,3'-diaminobenzidine tetrahydrochloride dihydrate (HistoGreen; green signal), and sections were counterstained with hematoxylin or light green. Bars = 50 μm (a–d, g, h) and 100 μm (e, f). (i) qRT-PCR of RAGE genes. Transcript levels normalized to S18-RNA values. Error bars indicate the means ± SD (n = 6): in RAGE: 0.09 ± 0.004 for non-DM kidney and 0.79 ± 0.28 for STZ-DM kidney. Statistical significance was determined by unpaired Student’s t-test.
Fig. 5.
Fig. 5.
Increasing mitochondrial mass in STZ-DM kidney. (a, b) Sections immunostained with MT-CO1, a molecular marker of mitochondria. (b) STZ-DM renal tissues show strong expression of MT-CO1. Bars = 50 μm (a, b). (c) Quantitative estimation of mitochondrial marker gene expression in STZ-DM kidney. qRT-PCR of, MT-CO1, Letm1, Lamp1 and CTSD (main components of autophagy and the lysosomal system). Transcript levels normalized to S18-RNA values. Error bars indicate the means ± SD (n = 5); in MT-CO1: 45.8 ± 6.85 for non-DM kidney and 54.8 ± 4.46 for STZ-DM kidney; Letm1: 0.27 ± 0.08 for non-DM kidney and 0.37 ± 0.03 for STZ-DM kidney; Lamp1: 40.9 ± 5.12 for non-DM kidney and 60.3 ± 21.97 for STZ-DM kidney; CTSD: 30.0 ± 3.05 for non-DM kidney and 48.3 ± 9.97 for STZ-DM kidney. Statistical significance was determined by paired Student’s t-test.

References

    1. Bhargava P. and Schnellmann R. G. (2017) Mitochondrial energetics in the kidney. Nat. Rev. Nephrol. 13; 629–646. - PMC - PubMed
    1. Blantz R. C. (2014) Phenotypic characteristics of diabetic kidney involvement. Kidney Int. 86; 7–9. - PMC - PubMed
    1. Bohlender J. M., Franke S., Stein G. and Wolf G. (2005) Advanced glycation end products and the kidney. Am. J. Physiol. Renal Physiol. 289; F645–659. - PubMed
    1. Brunk U. T. and Terman A. (2002) The mitochondrial-lysosomal axis theory of aging: accumulation of damaged mitochondria as a result of imperfect autophagocytosis. Eur. J. Biochem. 269; 1996–2002. - PubMed
    1. Chen X., Ma J., Kwan T., Stribos E. G. D., Messchendorp A. L., Loh Y. W., Wang X., Paul M., Cunningham E. C., Habib M., Alexander I. E., Sharland A. F., Chadban S. J. and Wu H. (2018) Blockade of HMGB1 Attenuates Diabetic Nephropathy in Mice. Sci. Rep. 8; 8319. - PMC - PubMed