. 2020 Apr 17:11:329.
doi: 10.3389/fphys.2020.00329. eCollection 2020.

Azelaic Acid Induces Mitochondrial Biogenesis in Skeletal Muscle by Activation of Olfactory Receptor 544

Affiliations

Azelaic Acid Induces Mitochondrial Biogenesis in Skeletal Muscle by Activation of Olfactory Receptor 544

Trung Thanh Thach et al. Front Physiol. .

Abstract

Mouse olfactory receptor 544 (Olfr544) is ectopically expressed in varied extra-nasal organs with tissue specific functions. Here, we investigated the functionality of Olfr544 in skeletal muscle cells and tissue. The expression of Olfr544 is confirmed by RT-PCR and qPCR in skeletal muscle cells and mouse skeletal muscle assessed by RT-PCR and qPCR. Olfr544 activation by its ligand, azelaic acid (AzA, 50 μM), induced mitochondrial biogenesis and autophagy in cultured skeletal myotubes by induction of cyclic adenosine monophosphate-response element binding protein (CREB)-peroxisome proliferator-activated receptor gamma coactivator 1-alpha (PGC-1α)-extracellular signal-regulated kinase-1/2 (ERK1/2) signaling axis. The silencing Olfr544 gene expression abrogated these effects of AzA in cultured myotubes. Similarly, in mice, the acute subcutaneous injection of AzA induced the CREB-PGC-1α-ERK1/2 pathways in mouse skeletal muscle, but these activations were negated in those of Olfr544 knockout mice. These demonstrate that the induction of mitochondrial biogenesis in skeletal muscle by AzA is Olfr544-dependent. Oral administration of AzA to high-fat-diet fed obese mice for 6 weeks increased mitochondrial DNA content in the skeletal muscle as well. Collectively, these findings demonstrate that Olfr544 activation by AzA regulates mitochondrial biogenesis in skeletal muscle. Intake of AzA or food containing AzA may help to improve skeletal muscle function.

Keywords: azelaic acid; mitochondrial biogenesis; myotube; olfactory receptor 544; skeletal muscle.


Figures

FIGURE 1
FIGURE 1
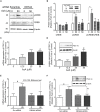
Activation of Olfr544 induces the PKA-CREB-PGC-1α signaling axis in cultured skeletal muscle cells. (A,B) AzA induced pCREB expression in C2C12 myotubes but not in cells with Olfr544 knockdown. Immunoblotting analysis of pCREB and total CREB proteins (A, n = 3); the ratios of pCREB-to-CREB were normalized to β-actin (B, n = 3). (C,D) AzA induced the expression of PGC-1α both at the mRNA (C, n = 3) and protein levels (D, n = 3) in a dose-dependent manner as measured by real-time qPCR and immunoblotting, respectively. (E,F) Olfr544 gene knockdown lessens Pgc-1α gene expression (E, n = 3) and protein expression (F, n = 3). Data are the mean ± SEM. Data are statistically significant different denoted by * for P ≤ 0.05 using Wilcoxon test and one-way ANOVA followed by Tukey’s HSD test.
FIGURE 2
FIGURE 2
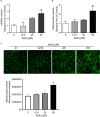
AzA induces mitochondrial biogenesis in skeletal muscle cells. (A) AzA induces mtDNA content in a dose-dependent manner as measured by Qpcr (n = 4). (B) Mitochondrial contents were probed by green MitoTracker and measured by a spectrophotometer (n = 4). (C) and the levels of mitochondrial content was confirmed under confocal fluorescence microscopy (n = 3). Blue, nucleus; green, mitochondrion. Scale bar, 50 μm. Data are the mean ± SEM. Data are statistically significant different denoted by * for P ≤ 0.05 using Wilcoxon test and one-way ANOVA followed by Tukey’s HSD test.
FIGURE 3
FIGURE 3
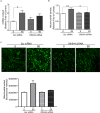
Olfr544 deficiency negates mitochondrial biogenesis stimulated by AzA in skeletal muscle cells. (A) AzA induced mtDNA content in myotubes but not in Olfr544 knockdown cells (n = 8). Mitochondrial abundance was analyzed using a spectrophotometer (B, n = 8) and fluorescence imaging (C, n = 3). Scale bar, 50 μm. Data are the mean ± SEM. Data are statistically significant different denoted by * for P ≤ 0.05, ** for P ≤ 0.01 using Wilcoxon test and one-way ANOVA followed by Tukey’s HSD test.
FIGURE 4
FIGURE 4
AzA-driven Olfr544 activation stimulates ERK1/2 phosphorylation in cultured skeletal muscle cells. AzA induced phosphorylation of ERK1/2 on Thr43/44 (pERK1/2) in myotubes but not in Olfr544 knockdown cells. (A,B) Expression of total ERK1/2 and pERK1/2 was probed by immunoblotting. Ratios of pERK1/2 to total ERK1/2 were normalized to β-actin (n = 3). (C,D) AzA-stimulated myotubes increased the LC3-II-to-LC3-I ratio, a marker of autophagosome formation, but not in Olfr544 knockdown cells (n = 3). Data are the mean ± SEM. Data are statistically significant different denoted by * for P ≤ 0.05, ** for P ≤ 0.01 using Wilcoxon test and one-way ANOVA followed by Tukey’s HSD test.
FIGURE 5
FIGURE 5
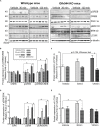
AzA-driven Olfr544 activation stimulates the CREB-PGC-1α signaling axis and autophagy formation in mouse skeletal muscle tissues. (A) AzA treatment induced the expression of PGC-1α, pCREB, pERK1/2 and LC3I/II protein in wild-type mouse skeletal muscle tissues but not in those of Olfr544 KO mice. Immunoblotting analysis of soleus muscles extracts for PGC-1α, pCREB, and CREB, pERK1/2 and total ERK1/2, LC3I/II (n = 3). (B–E) Ratios of pCREB, PGC-1α, pERK1/2, and LC3-II were normalized to β-actin (n = 3). Data are the mean ± SEM. Data are statistically significant different denoted by * for P ≤ 0.05 using Wilcoxon test and one-way ANOVA followed by Tukey’s HSD test.
FIGURE 6
FIGURE 6
Oral administration of AzA activates mitochondrial biogenesis in skeletal muscle tissues in HFD-induced obese mice. (A) AzA induced Pgc-1α gene expression in wild-type mouse skeletal muscle tissues but not in those of Olfr544 KO mice (n = 4). (B,C) Gene expression of the mitochondrial marker Tfam and mtDNA content were measured by real-time qPCR (n = 4). (D) Schematic illustration proposing the mechanism by which AzA-driven Olfr544 activation induces mitochondrial biogenesis in skeletal muscle cells by stimulation of CREB-PGC-1α signaling and ERK1/2 activity. Data are the mean ± SEM. Data are statistically significant different denoted by * for P ≤ 0.05 using Wilcoxon test and one-way ANOVA followed by Tukey’s HSD test.

References

    1. Bondia-Pons I., Barri T., Hanhineva K., Juntunen K., Dragsted L. O., Mykkänen H., et al. (2013). UPLC-QTOF/MS metabolic profiling unveils urinary changes in humans after a whole grain rye versus refined wheat bread intervention. Mol. Nutr. Food Res. 57 412–422. 10.1002/mnfr.201200571 - DOI - PubMed
    1. Bourquard T., Landomiel F., Reiter E., Crepieux P., Ritchie D. W., Aze J., et al. (2015). Unraveling the molecular architecture of a G protein-coupled receptor/beta-arrestin/Erk module complex. Sci. Rep. 5:10760. 10.1038/srep10760 - DOI - PMC - PubMed
    1. Buck L., Axel R. (1991). A novel multigene family may encode odorant receptors: a molecular basis for odor recognition. Cell 65 175–187. - PubMed
    1. Cagnol S., Chambard J. C. (2010). ERK and cell death: mechanisms of ERK-induced cell death–apoptosis, autophagy and senescence. FEBS J. 277 2–21. 10.1111/j.1742-4658.2009.07366.x - DOI - PubMed
    1. Cory M. D., Ji L., David L. W. (2016). Caloric restriction normalizes obesity-induced alterations on regulators of skeletal muscle growth signaling. Lipid 51 905–912. 10.1007/s11745-016-4168-3 - DOI - PMC - PubMed

LinkOut - more resources