. 2019 Aug 24:1:275-282.
doi: 10.1016/j.fsisyn.2019.07.001. eCollection 2019.

Homicide in Denmark 1992-2016

Affiliations

Homicide in Denmark 1992-2016

Asser H Thomsen et al. Forensic Sci Int Synerg. .

Abstract

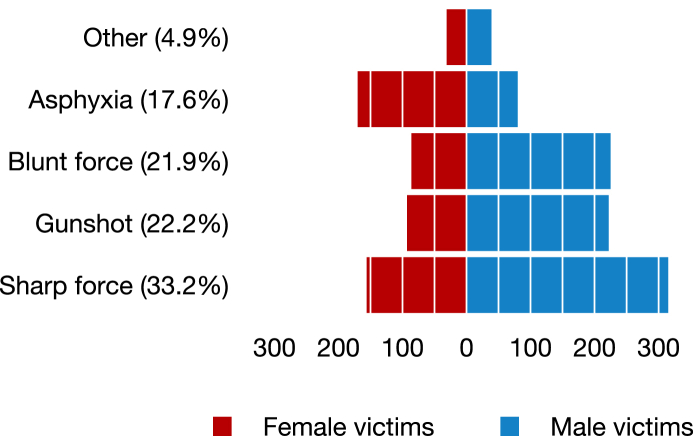
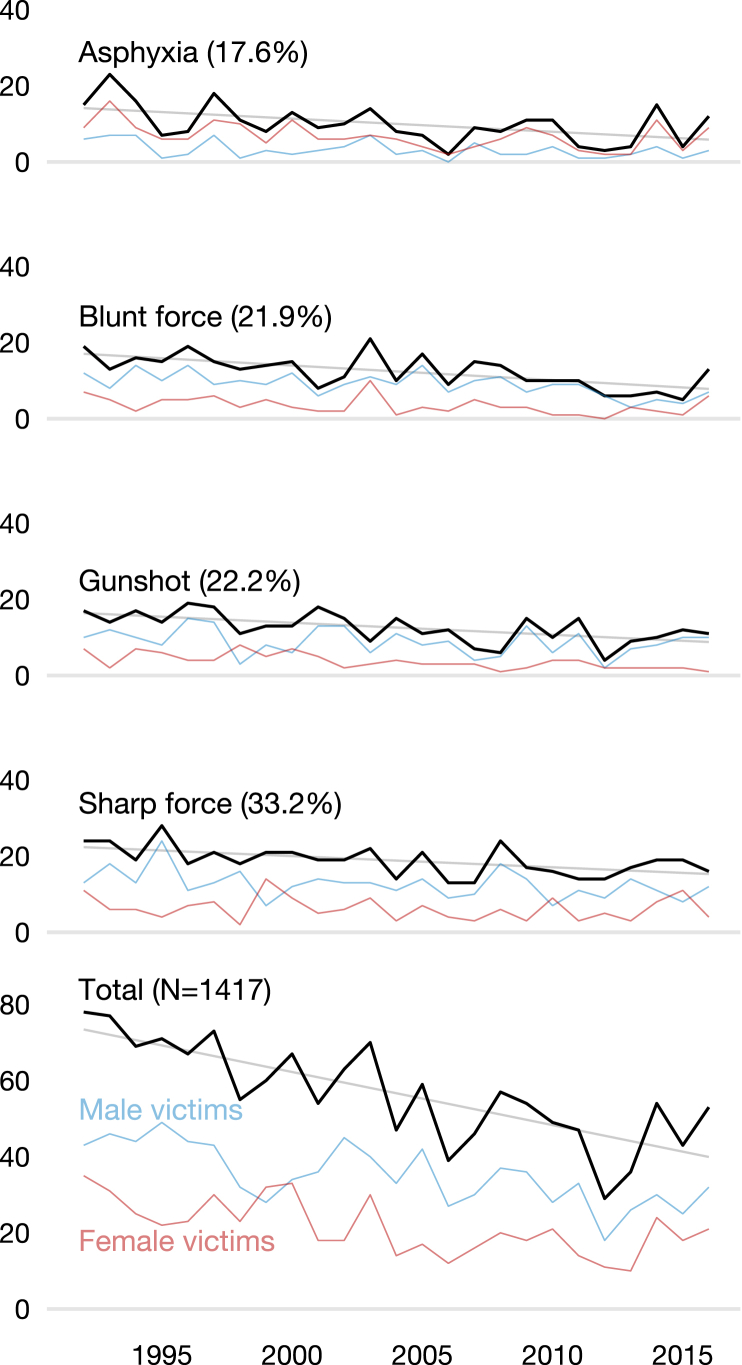
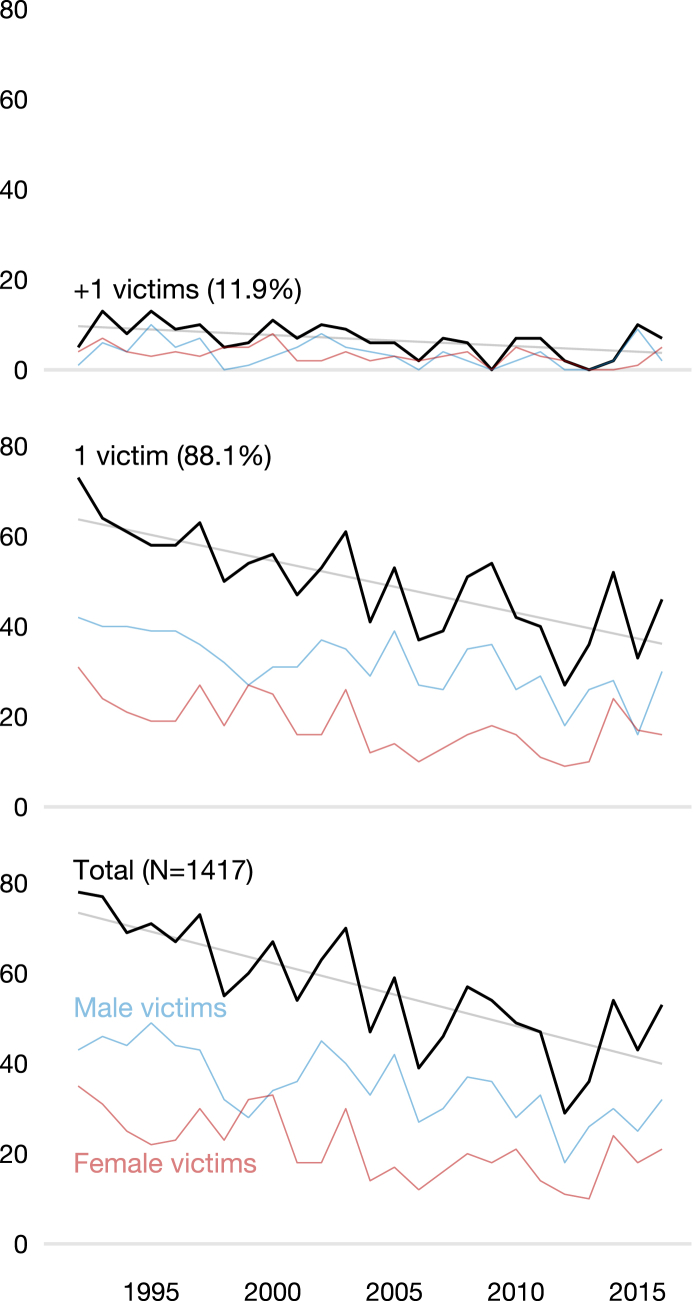
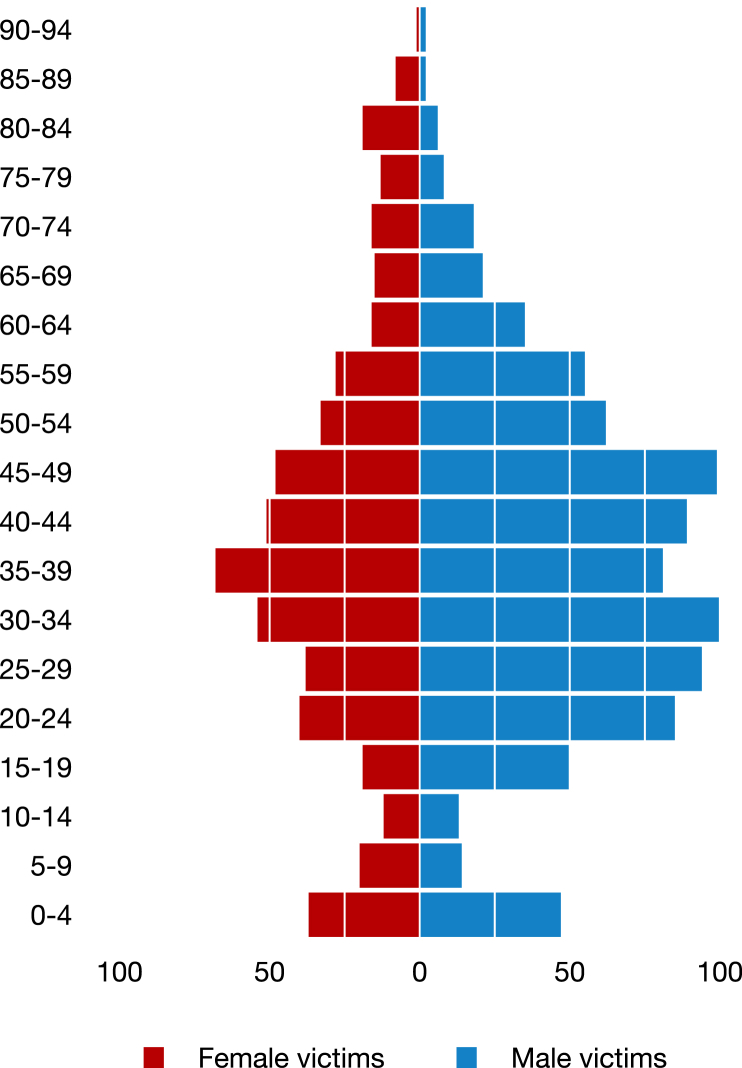
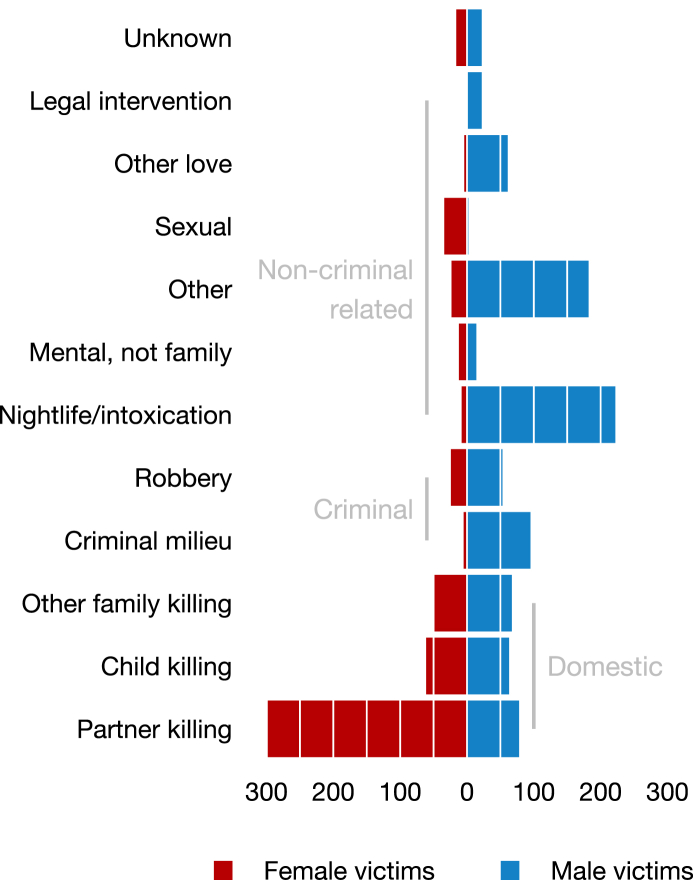
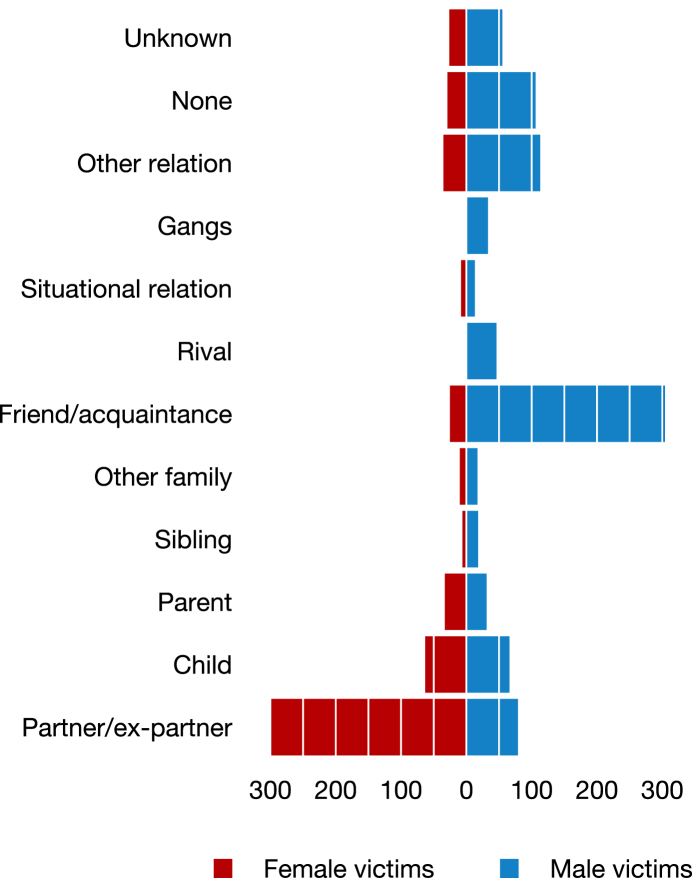
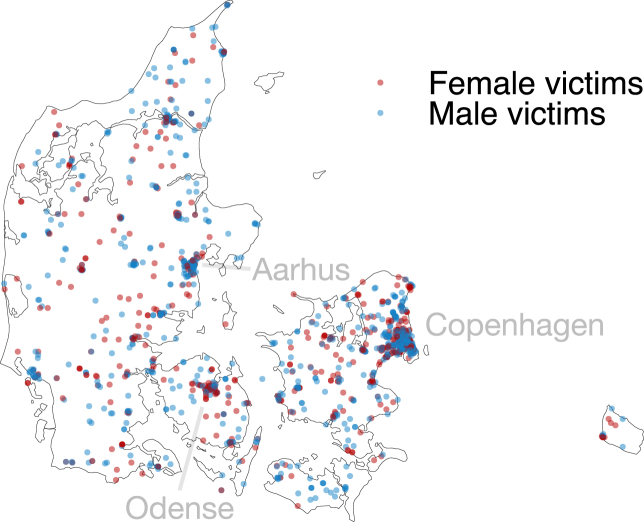
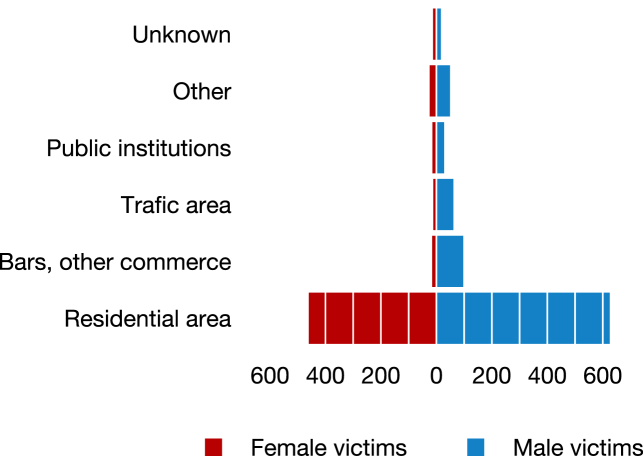
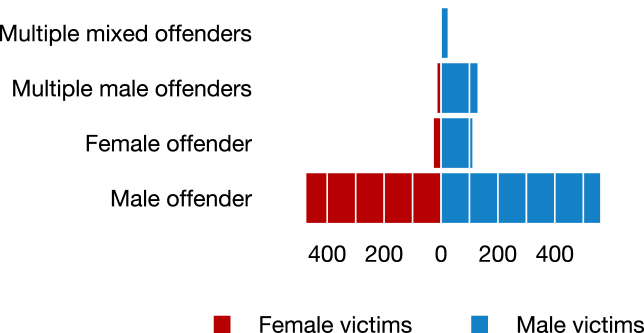
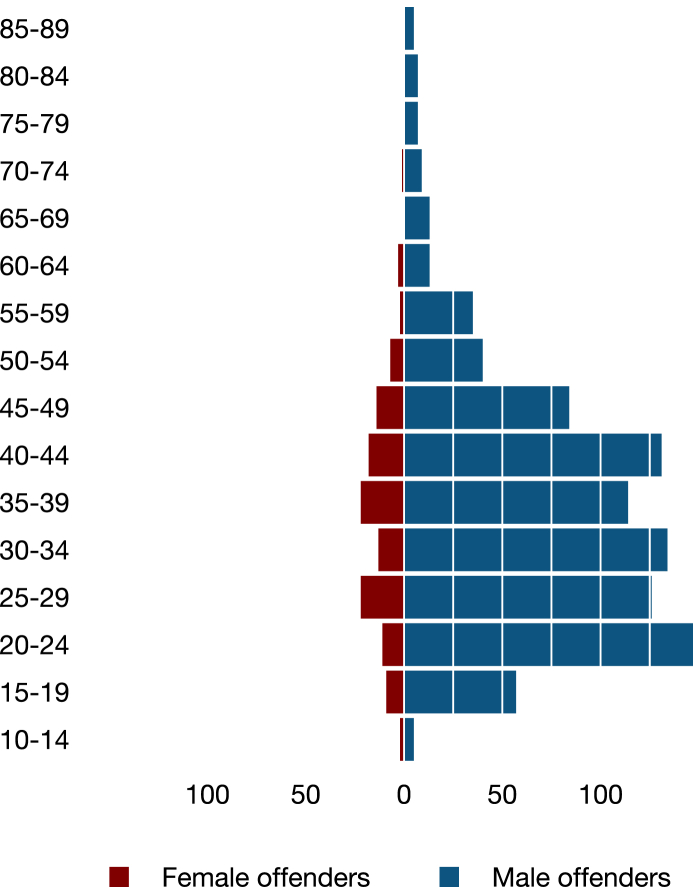
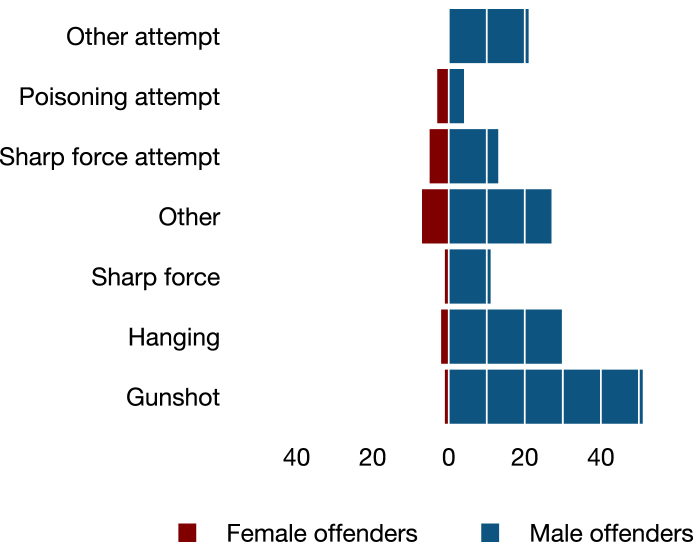
We present the findings for homicides in Denmark for 1992-2016. There were 1417 homicide victims (62.2% males, 37.8% females) that were killed in 1321 homicide events. The most common methods were sharp force trauma (33.2%), gunshot (22.2%), blunt force trauma (21.9%) and asphyxia (17.6%), and all methods exhibited a reduction during the study period. The homicide rate was 1.05 per 100,000, 1.32 per 100,000 for males, and 0.78 per 100,000 for females. Domestic homicides were the largest main group of homicides (76.5% of all female victims vs. 23.6% of male victims). Of the non-domestic homicides, 84.2% of victims were male, the largest group being in the setting of nightlife and/or intoxication. Most female victims (76.9%) were killed by someone in their family, while the largest share of male victims (34.5%) were killed by a friend or acquaintance. The offenders were males in 87.9% of all homicides.

Keywords: Forensic pathology; Homicide; Interpersonal violence.


Figures

Fig. 1
Fig. 1
Homicide methods related to sex of victim. The bars show the number of homicides for each main group (See Supplementary Table 1).
Fig. 2
Fig. 2
The change in the number of homicides 1992–2016 in the main groups of homicide methods and total homicides.
Fig. 3
Fig. 3
The change in the number of homicides 1992–2016 for homicide events with one victim and multiple victims.
Fig. 4
Fig. 4
Age-sex pyramid for homicide victims. The bars show the number of homicides for each age group in 5-year intervals.
Fig. 5
Fig. 5
The time of the homicide, weekday and time of day. The bars show the number of homicides for each 12-h time slot. The dotted line represents the mean.
Fig. 6
Fig. 6
Homicide type related to sex of victim. The bars show the number of homicides for each main group (See Supplementary Table 2).
Fig. 7
Fig. 7
Motive related to sex of victim. The bars show the number of homicides for each main group, and each homicide can be represented in more than one group.
Fig. 8
Fig. 8
Relation of homicide victim to the offender(s). The bars show the number of homicides for each main group (See Supplementary Table 3).
Fig. 9
Fig. 9
Map of Denmark with plots of the homicide locations.
Fig. 10
Fig. 10
Homicide type of location related to sex of victim. The bars show the number of homicides for each main group.
Fig. 11
Fig. 11
Offender sex related to sex of victim. The bars show the number of homicides for each main group.
Fig. 12
Fig. 12
Age-sex pyramid for homicide offenders. The bars show the number of offenders for each age group in 5-year intervals.
Fig. 13
Fig. 13
Offender suicide method related to the sex of the offender. The bars show the number of offenders for each main group.

References

    1. Crime U.N.O.o.D.a. 2013. Global Study on Homicide 2013: Trends, Contexts, Data.
    1. Hart Hansen J.P. 1977. Drab i Danmark 1946-70.
    1. Leth P.M. Homicides in Southern Denmark during 25 years. Homicide Stud. 2010;14(4):419–435. doi: 10.1177/1088767910384074. - DOI
    1. Eisner M. Modernity strikes back? A historical perspective on the latest increase in interpersonal violence (1960-1990) Int. J. Comput. Vis. 2008;2(2):288–316.
    1. Helweg-Larsen K. The Danish register of Causes of death. Scand. J. Publ. Health. 2011;39(7 Suppl):26–29. doi: 10.1177/1403494811399958. - DOI - PubMed

LinkOut - more resources